Dashboard
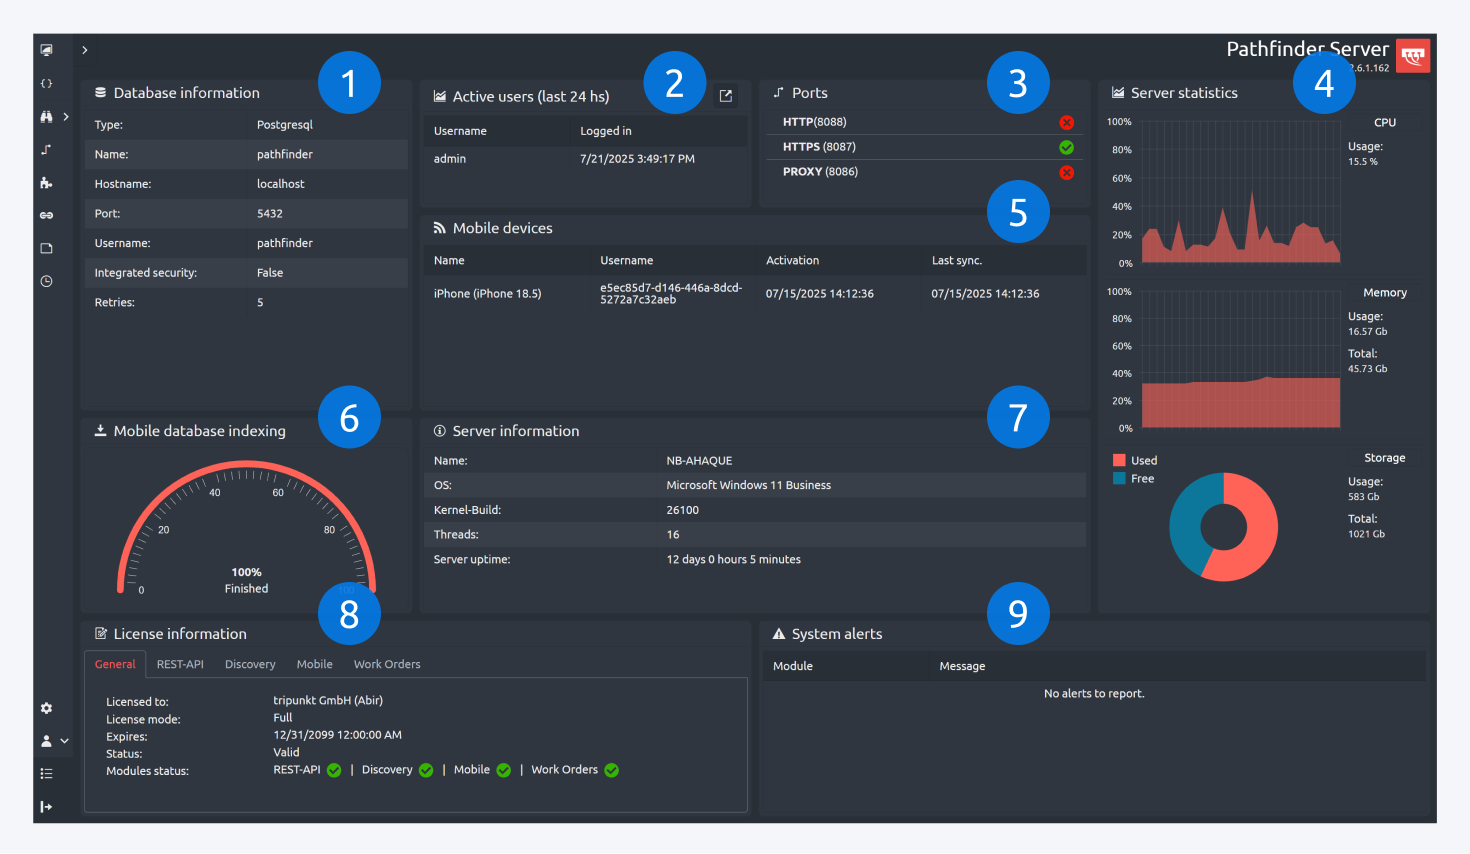
The Pathfinder Server web interface provides a centralized, read-only summary of system status, resource utilization, and operational metrics across Pathfinder modules. This section is designed to support administrators in monitoring the health and performance of the Pathfinder environment.
Key Features:
Database Information
Displays configuration details for the active database connection, including:
Database type (e.g., PostgreSQL)
Database name
Hostname and port
Authentication method and credentials status
Active Users
Displays a log of users who accessed the system within the last 24 hours.
Includes usernames and login timestamps across Pathfinder Client, Server, and Mobile.
Ports
Shows the current port configuration from the active settings file.
Status indicators (e.g., green for active, red for inactive) are provided for:
HTTP
HTTPS
Proxy
Server Statistics
Real-time performance metrics:
CPU usage (graphical representation)
Memory usage (used vs. total)
Storage usage (pie chart showing used space)
Mobile Devices
Lists all connected mobile devices with metadata:
Device name and model
Associated username and ID
Activation and last synchronization timestamps
Mobile Database Indexing
Indicates the current progress of mobile database indexing.
Ensures mobile clients are synchronized with the latest data.
Server Information
Provides general system-level details:
Server hostname
Operating system and kernel build
Thread count
Server uptime (formatted as days, hours, minutes)
License Information
Summarizes the current license configuration.
Includes module-specific tabs such as:
REST API
Discovery
Mobile
Work Orders
System Alerts
Displays any active alerts or warnings relevant to system health or configuration.
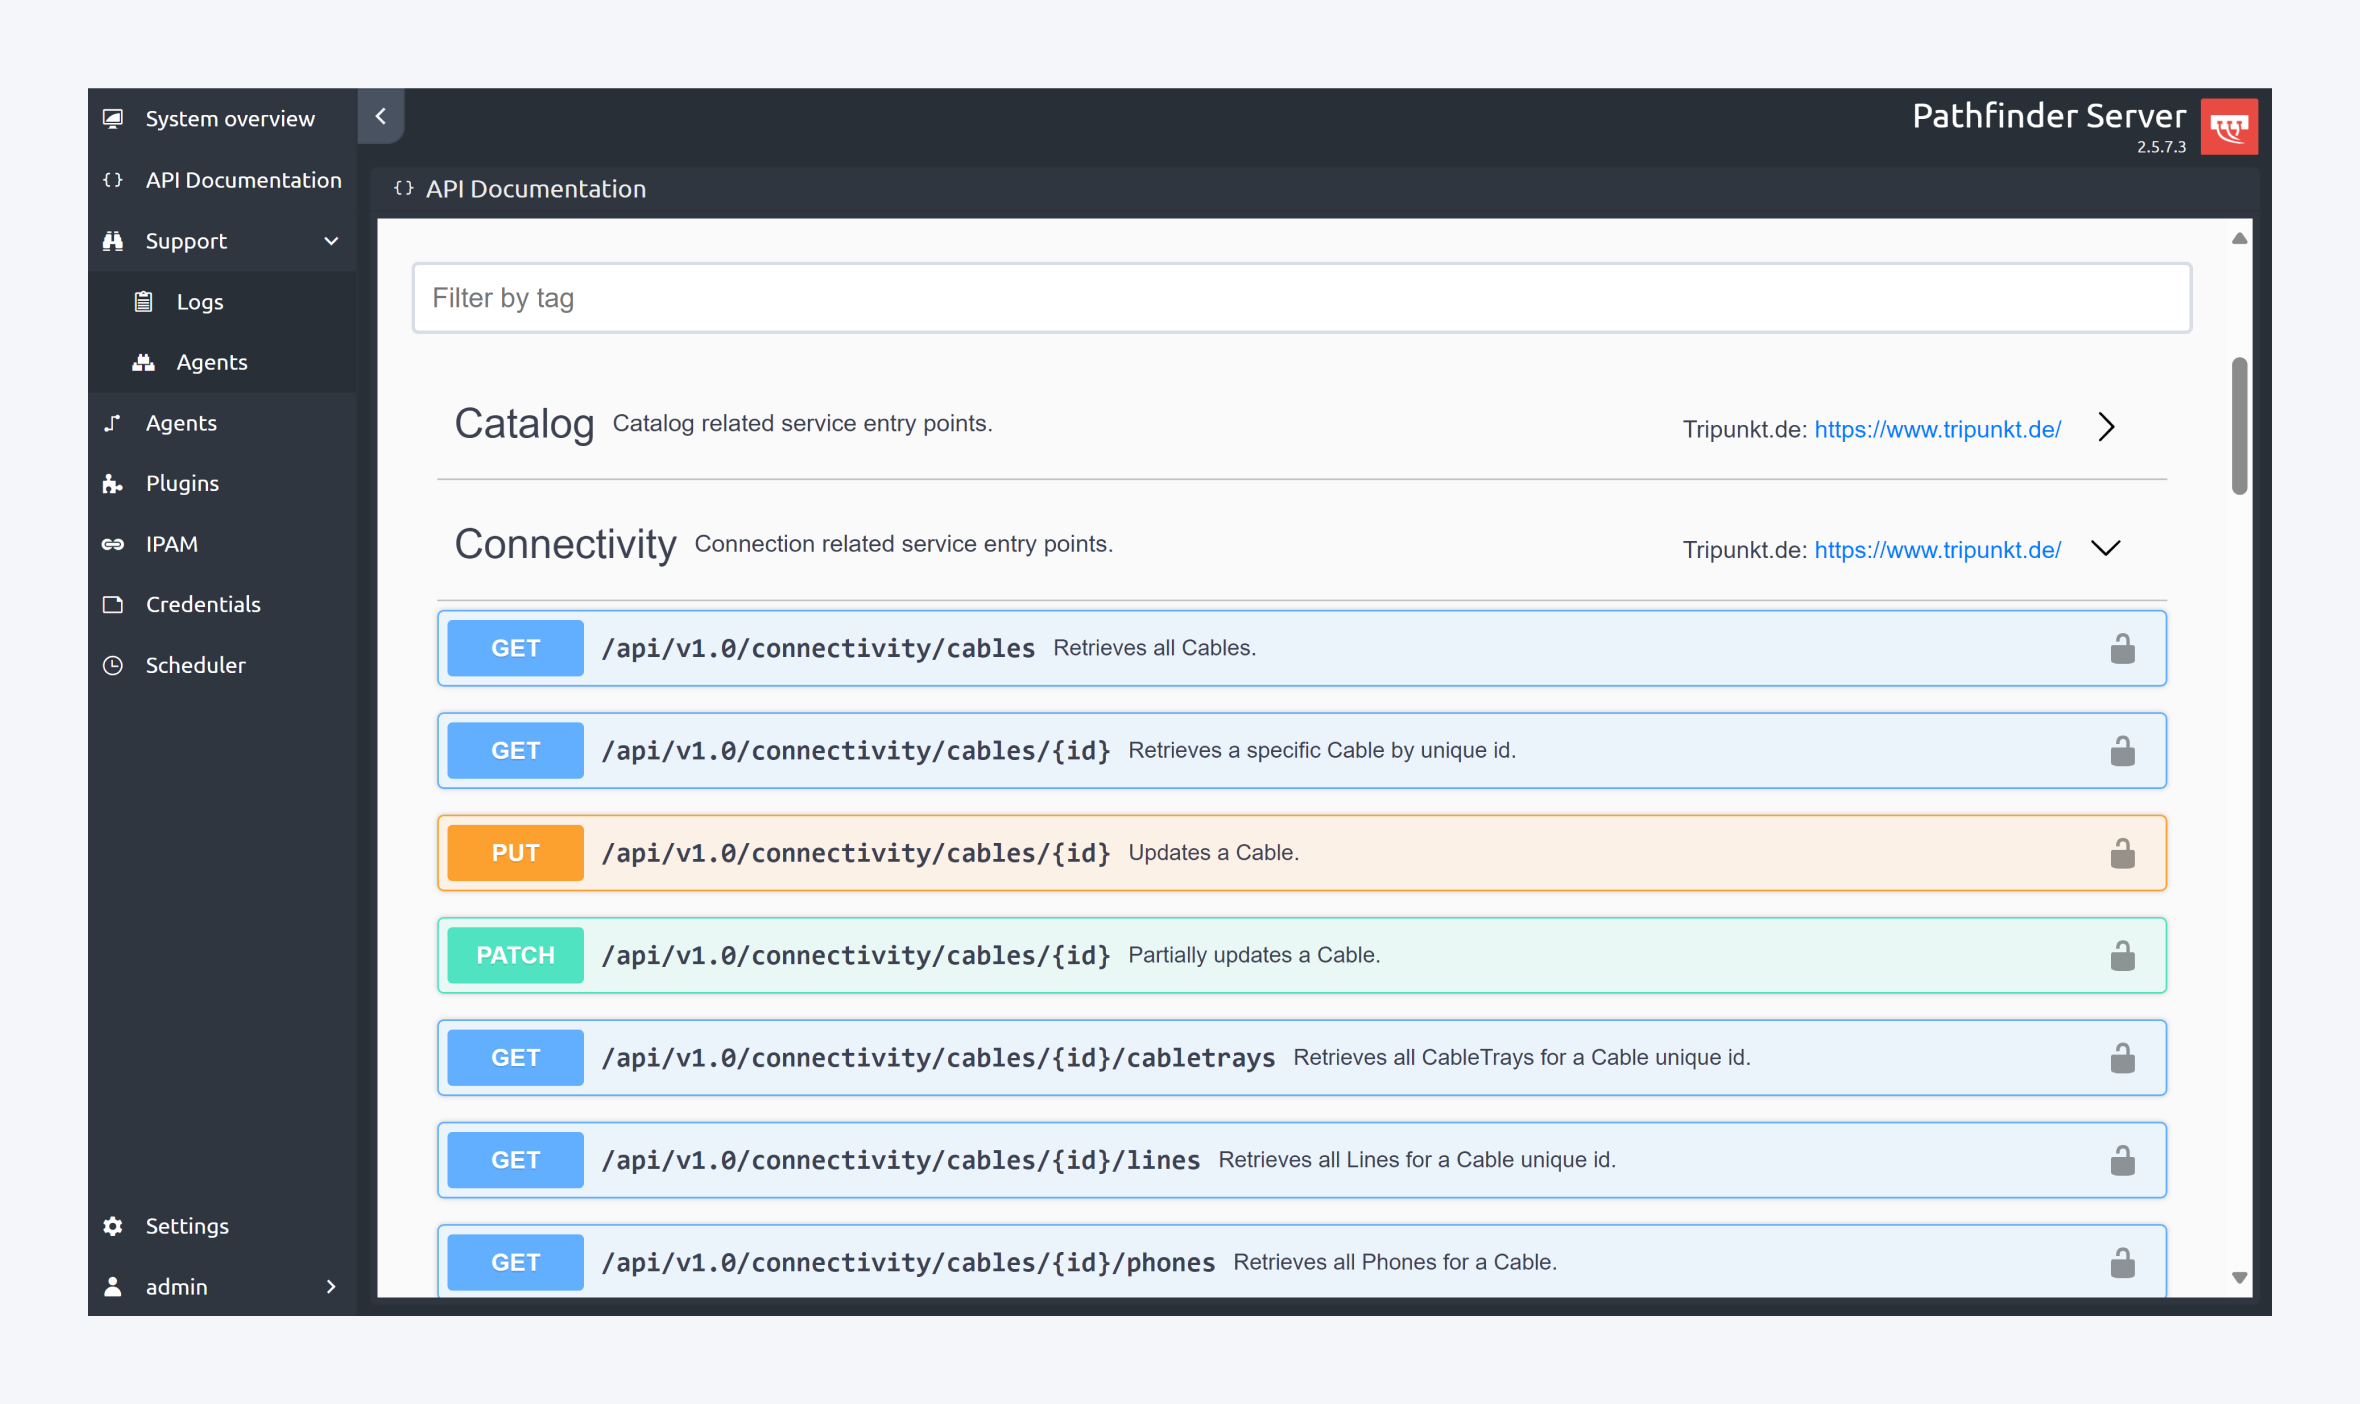
API Documentation
The API Documentation section of the Pathfinder Server web interface provides an interactive reference for all available REST API endpoints. This interface enables developers and administrators to explore, filter, and test API operations directly within the browser.
Key Features:
Interactive Endpoint Explorer:
Endpoints are organized by functional categories such as Catalog and Connectivity. Each endpoint is listed with its HTTP method (e.g.,
GET,PUT,PATCH) and a brief description of its function.
Search and Filter:
Use the "Filter by tag" search bar to quickly locate specific endpoints by category or keyword.
Live Testing with API Keys:
Users can execute API calls directly from the interface by authorizing access with an API key.
API keys must be generated in the Pathfinder Client under the API Key Management section.
For detailed instructions on generating and managing API keys, please refer to the documentation here: Manage API Keys.
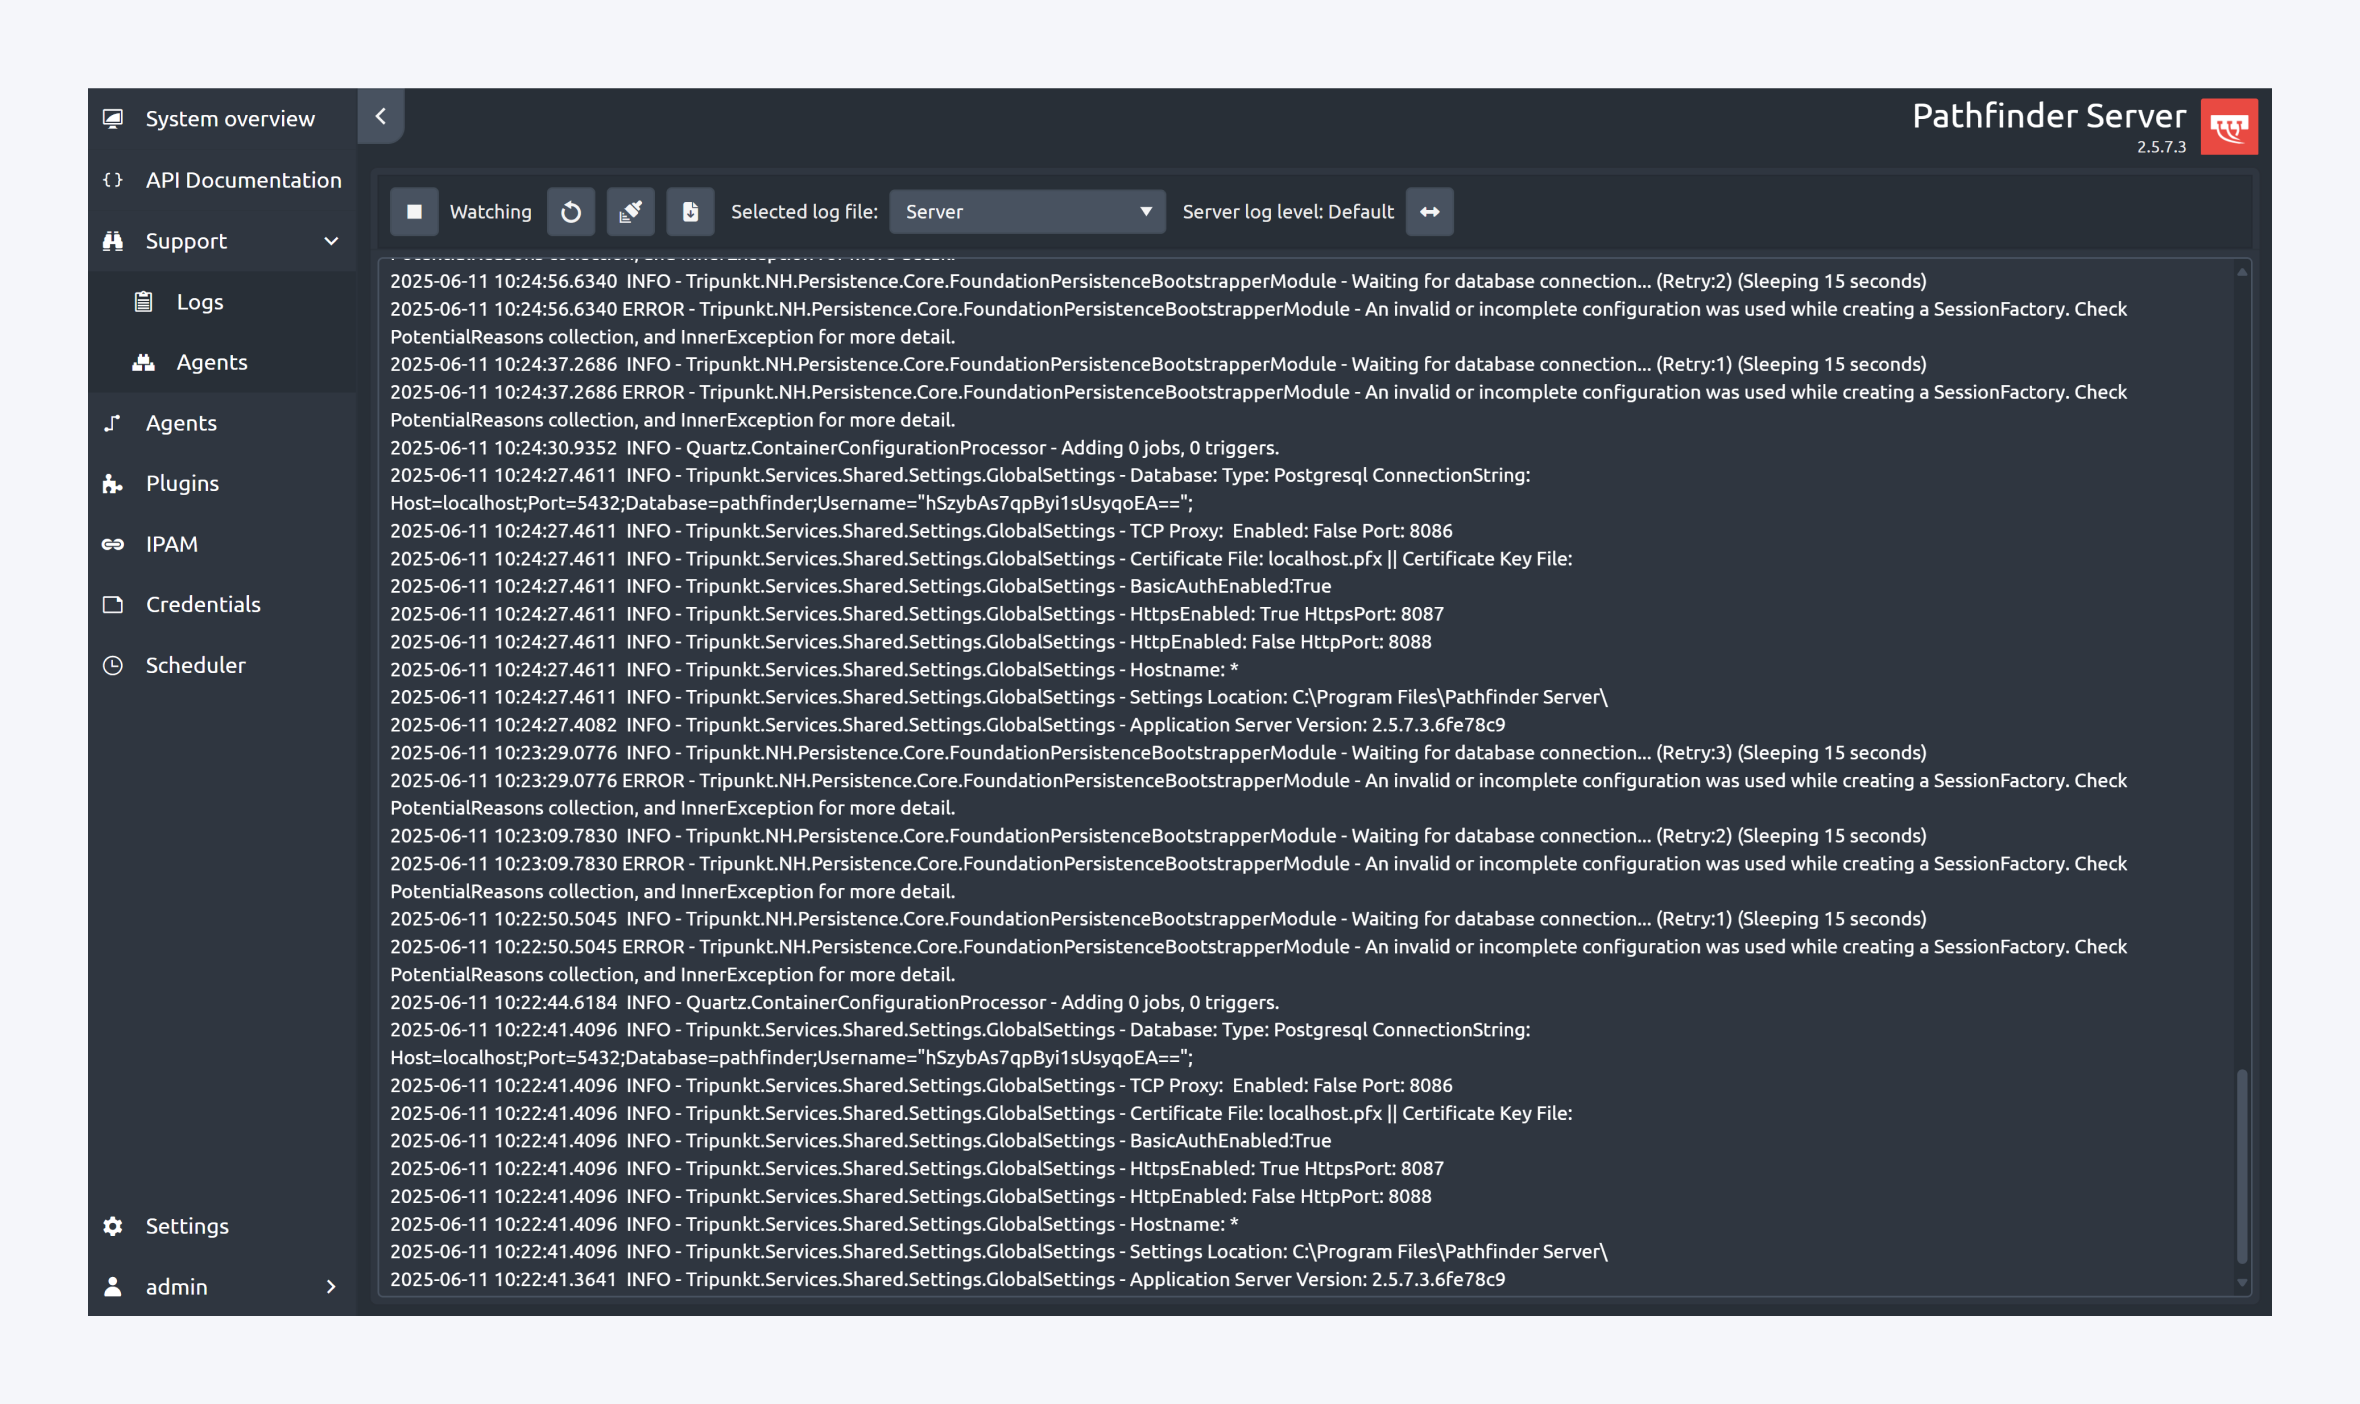
Support: Logs
The Logs section of the Pathfinder Server web interface provides real-time visibility into system operations, configuration changes, and error events. This feature is essential for administrators to monitor server health, diagnose issues, and audit system behavior.
Key Features:
Live Log Monitoring
The interface displays a continuously updating stream of log entries, each timestamped and categorized by severity level (e.g.,
INFO,ERROR).
Log File Selection
Users can select from available log sources (e.g., Server) to view specific types of system activity.
Log Level Filtering
The log level can be adjusted from the default setting to more granular levels such as
TRACE, enabling deeper diagnostic output.
Start/Stop Logging
Logging can be paused or resumed as needed for focused analysis.
Download Logs
All log data can be exported for offline review or archival purposes.
Available Log Files:
The server maintains a structured set of log files, including:
tripunkt.log– Core application loggingnhibernate.log– ORM and database session activitysystem.snapshot– System state snapshotsystem.info– General system informationapplication.info– Application-level eventsserver.windows.events.info– Windows event logs related to the serveragent.log– Logs from Pathfinder Discovery Agentsagent.system.info– System information from agentsagent.system.snapshot– Snapshot of agent system stateagent.windows.events.info– Windows event logs from agents
Each log entry includes a timestamp, severity level, and a descriptive message, providing a comprehensive audit trail of server and agent activity.
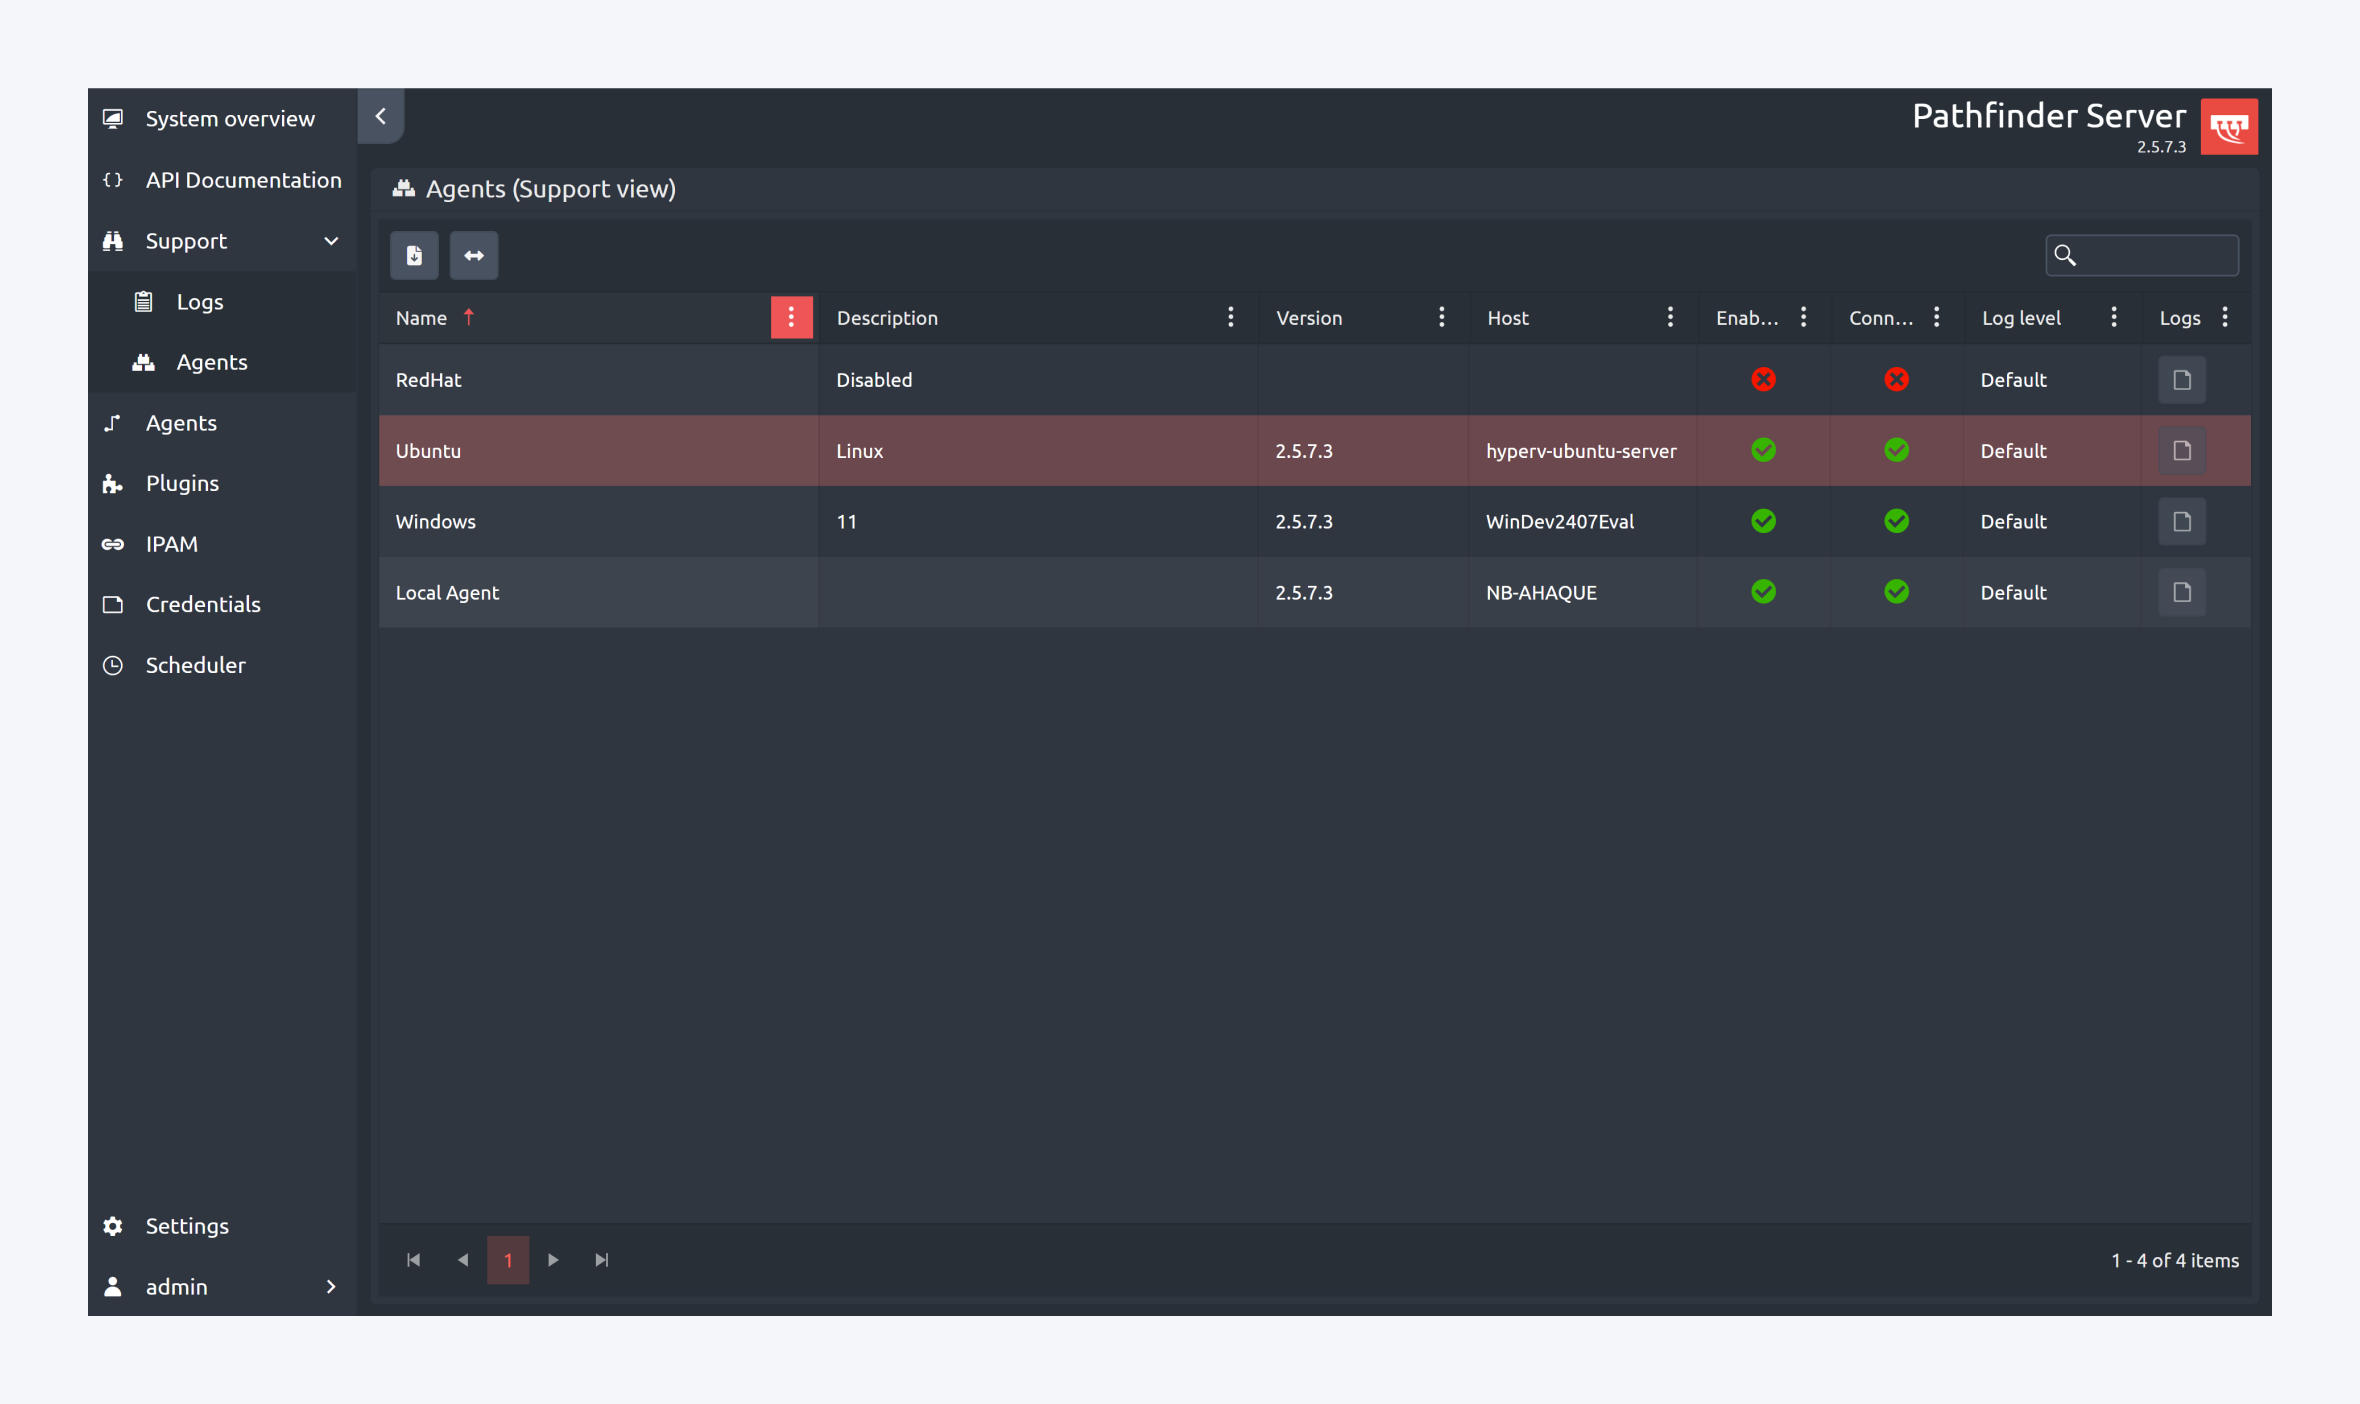
Support: Agents
The Agent Logs section provides targeted logging capabilities for each Pathfinder Discovery Agent deployed across the network. This interface allows administrators to monitor agent-specific activity, adjust logging verbosity, and export logs for diagnostics or compliance.
Key Features:
Agent Overview Table
Displays metadata for each registered agent, including:Agent name and description
Software version
Host system
Enabled status (visual indicators)
Connection status (visual indicators)
Current log level (e.g., Default, Trace)
Log Level Control
Administrators can dynamically adjust the logging level per agent to increase detail (e.g., switching from Default to Trace) for troubleshooting or performance analysis.Log Access and Export
Each agent includes a dedicated log viewer and download option, enabling secure access to historical and real-time log data.
Agent-Specific Log Files:
The following log files are maintained for each agent:
application.info– General application-level eventsagent.log– Core agent activity and operationsagent.system.info– System information collected by the agentagent.system.snapshot– Snapshot of the agent’s system statewindows.events.info– Windows event logs (for agents running on Windows)
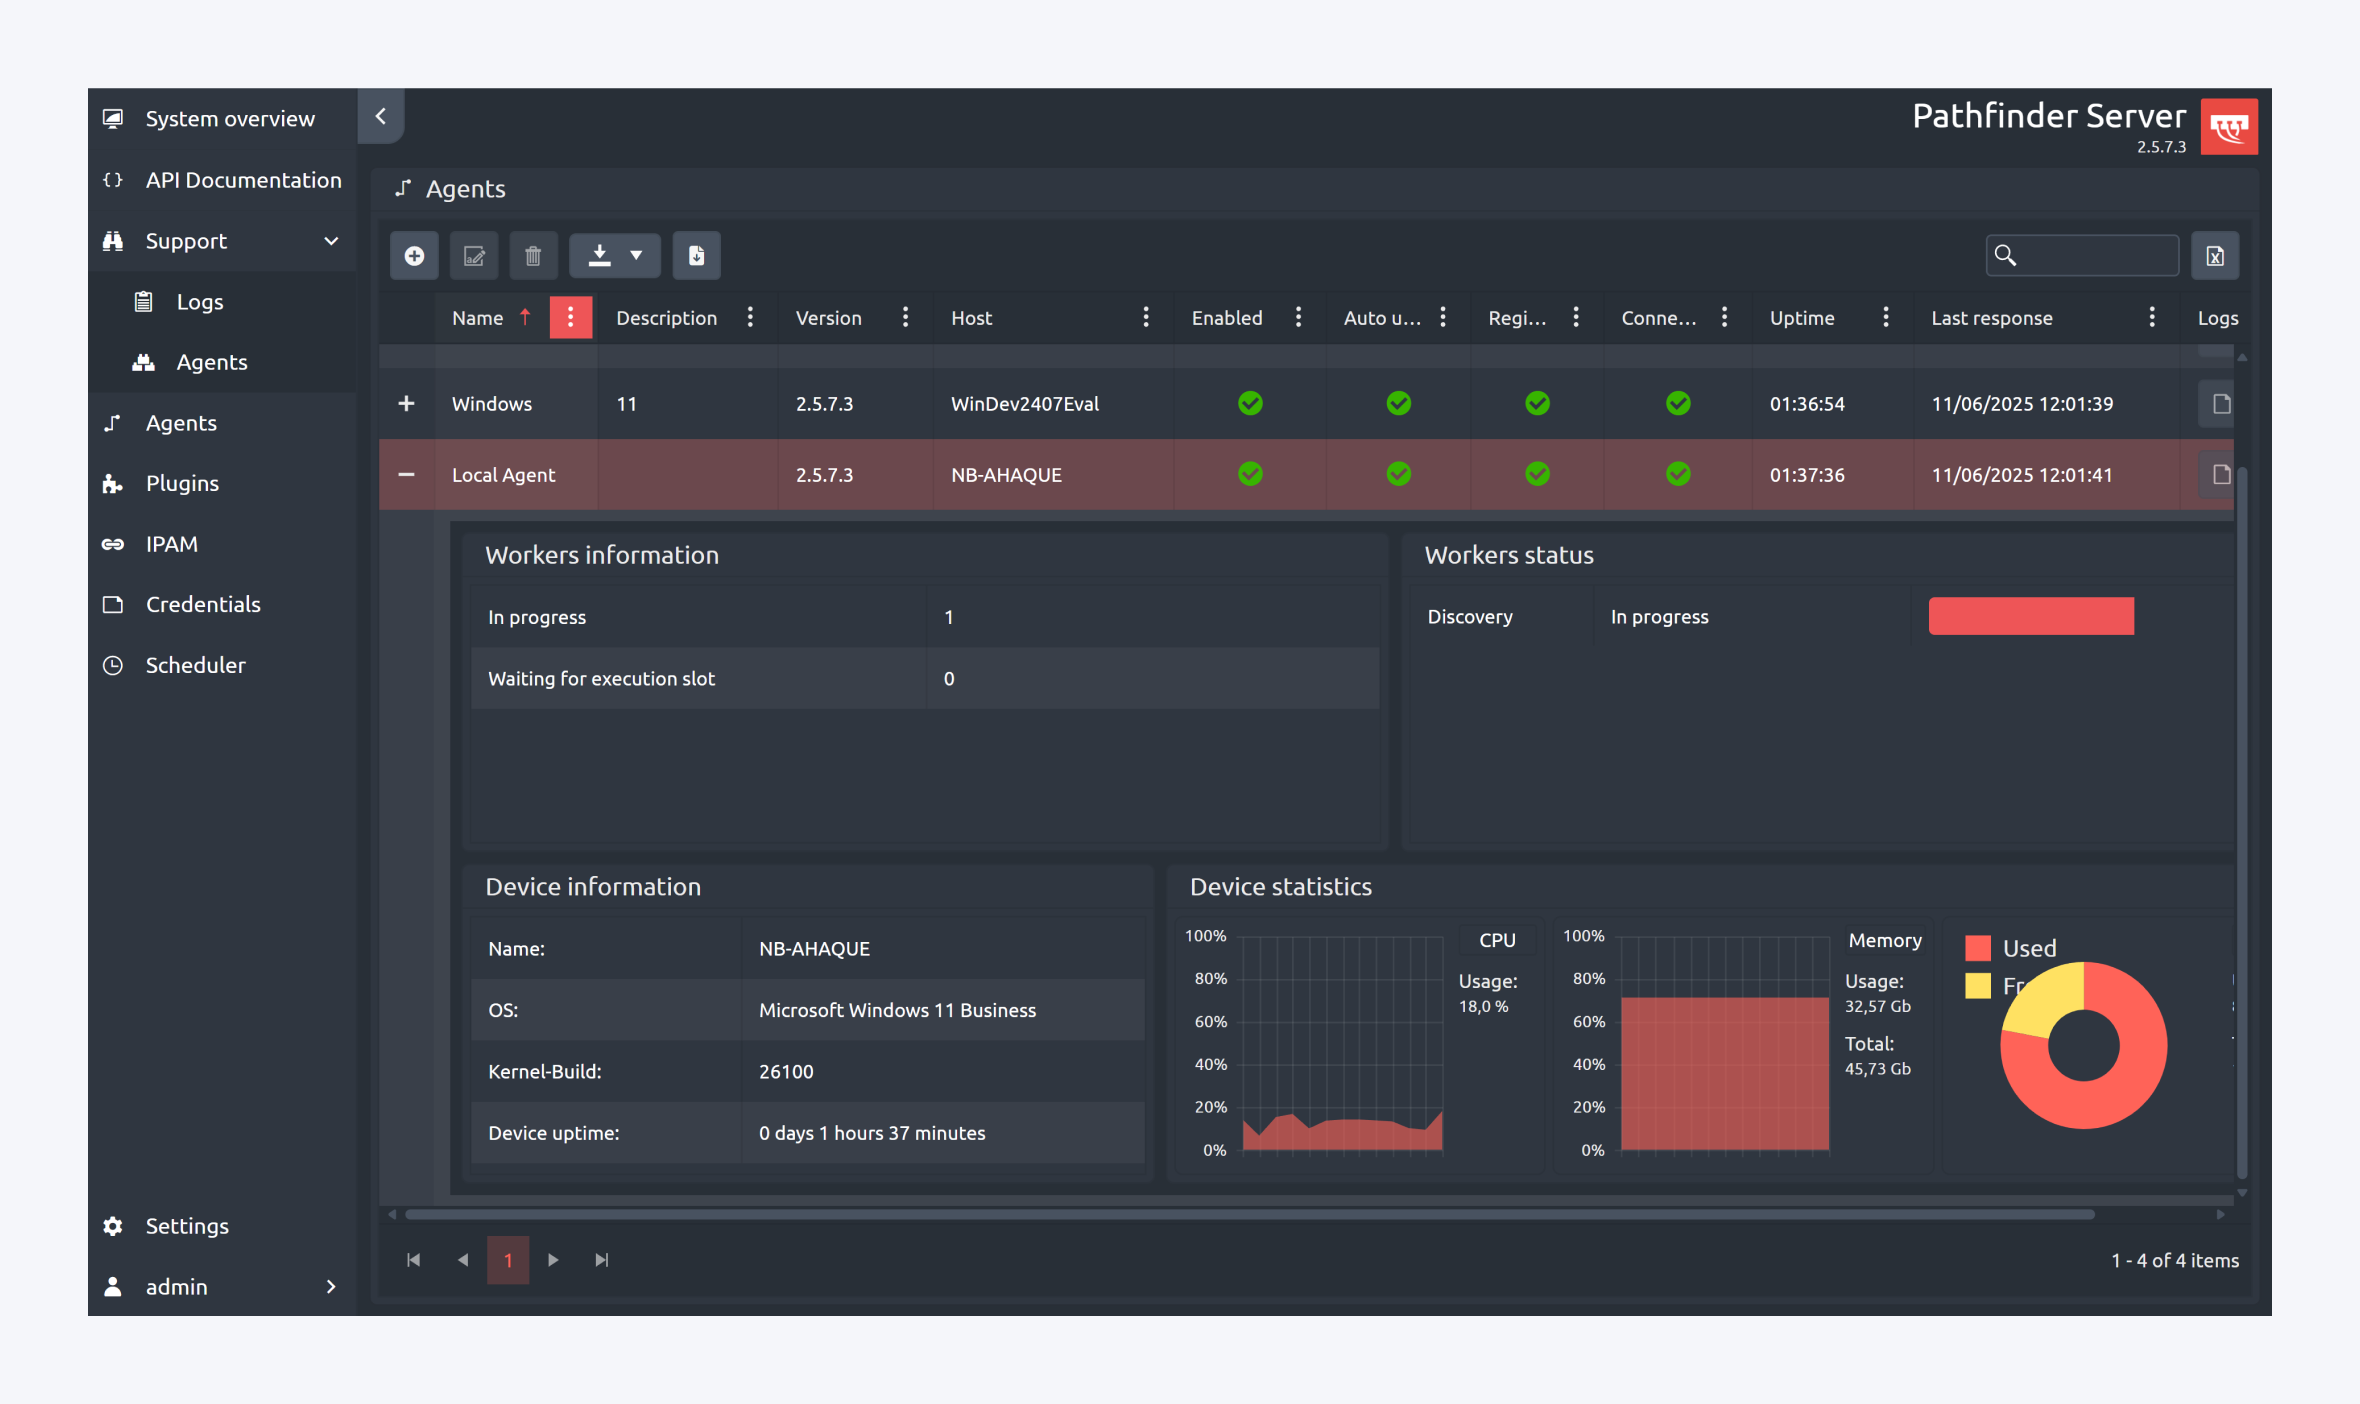
Agents
The Agent Management section of the Pathfinder Server interface provides centralized control over all deployed discovery agents. These agents are responsible for collecting network data from their assigned subnets, as defined by active discovery jobs.
Key Features:
Agent Lifecycle Management
Create new remote agents for deployment across supported operating systems.
Edit configuration details of existing agents (excluding the local agent).
Delete remote agents that are no longer required.
Download platform-specific installers for remote agent deployment.
Agent Monitoring
View detailed metadata for each agent, including:
Agent ID, description, version, and host system
Enabled and connection status
Auto-update and registration status
Uptime and last response timestamp
Log Access
Download agent-specific log files directly from the interface for diagnostics and auditing.
This section also provides real-time visibility into agent performance and system resource usage, including CPU and memory statistics, as well as the status of discovery workers.
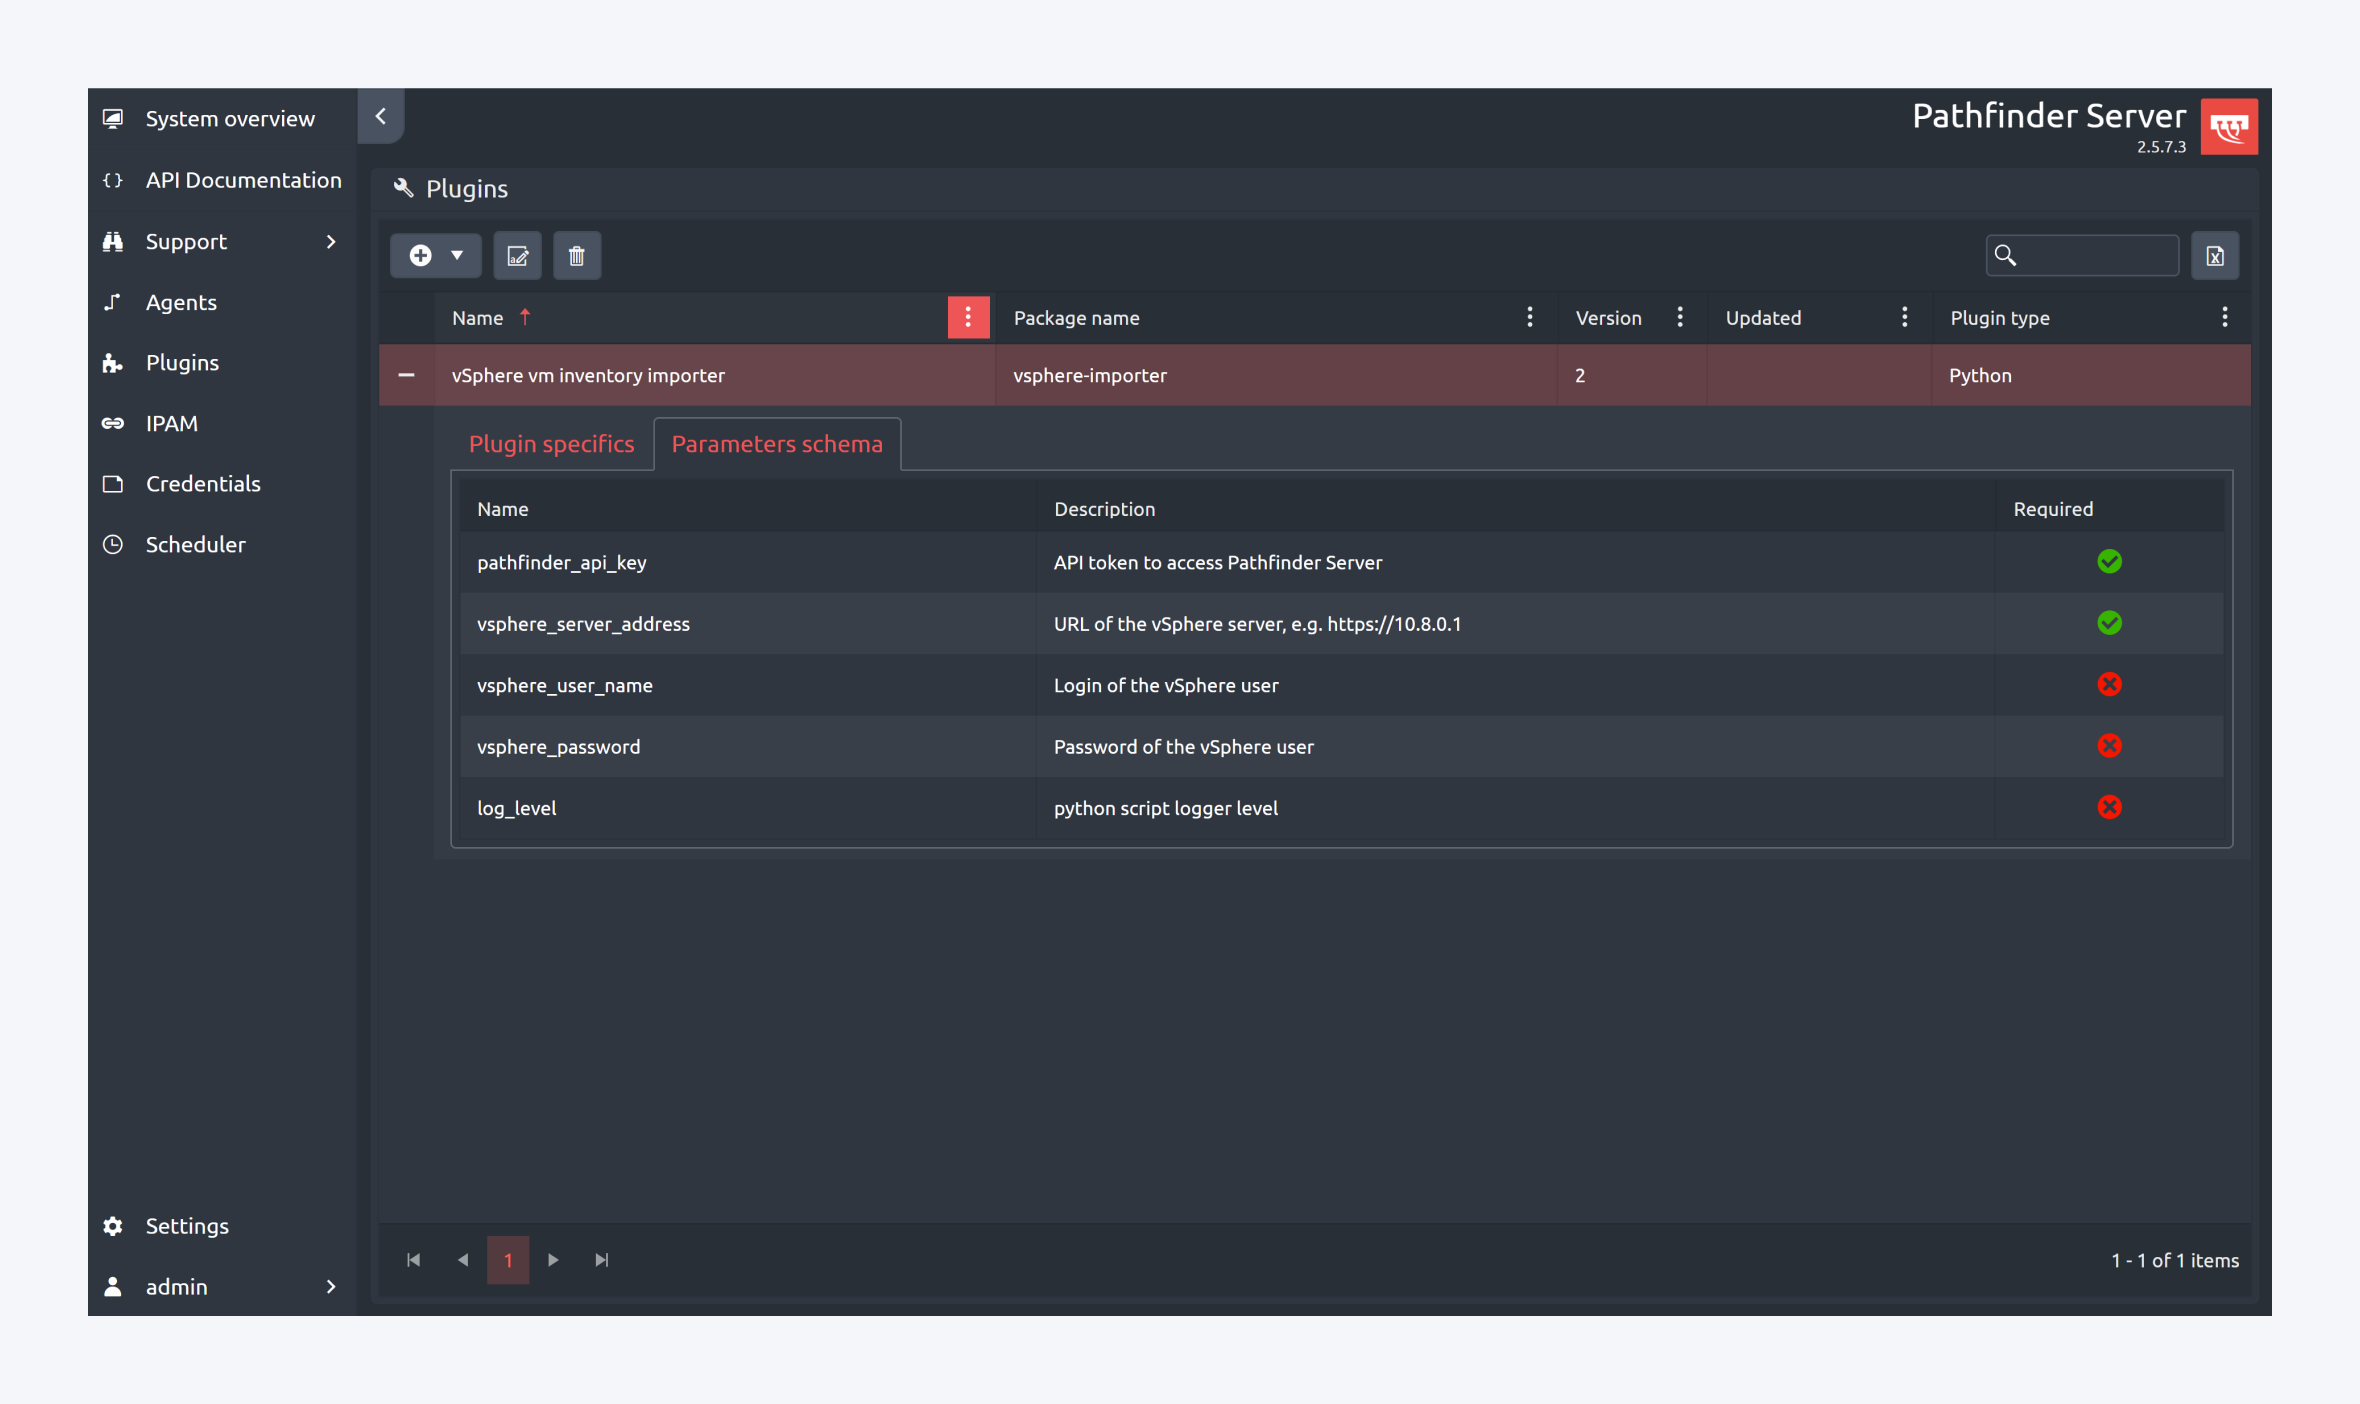
Plugins
The Plugins section of the Pathfinder Server interface enables users to extend system functionality by integrating custom Python scripts. These plugins can be used to automate tasks, import external data, or interact with third-party systems.
Key Features:
Plugin Management
View all installed plugins with metadata including:
Name, package name, version, update status, and plugin type (e.g., Python)
Upload and register custom Python-based plugins
Parameter Configuration
Each plugin includes a Parameters Schema tab where required inputs are defined
Example parameters for a vSphere integration plugin:
pathfinder_api_key: API token for authenticating with Pathfinder Servervsphere_server_address: URL of the vSphere servervsphere_user_name: Username for vSphere loginvsphere_password: Password for vSphere loginlog_level: Logging verbosity for the script
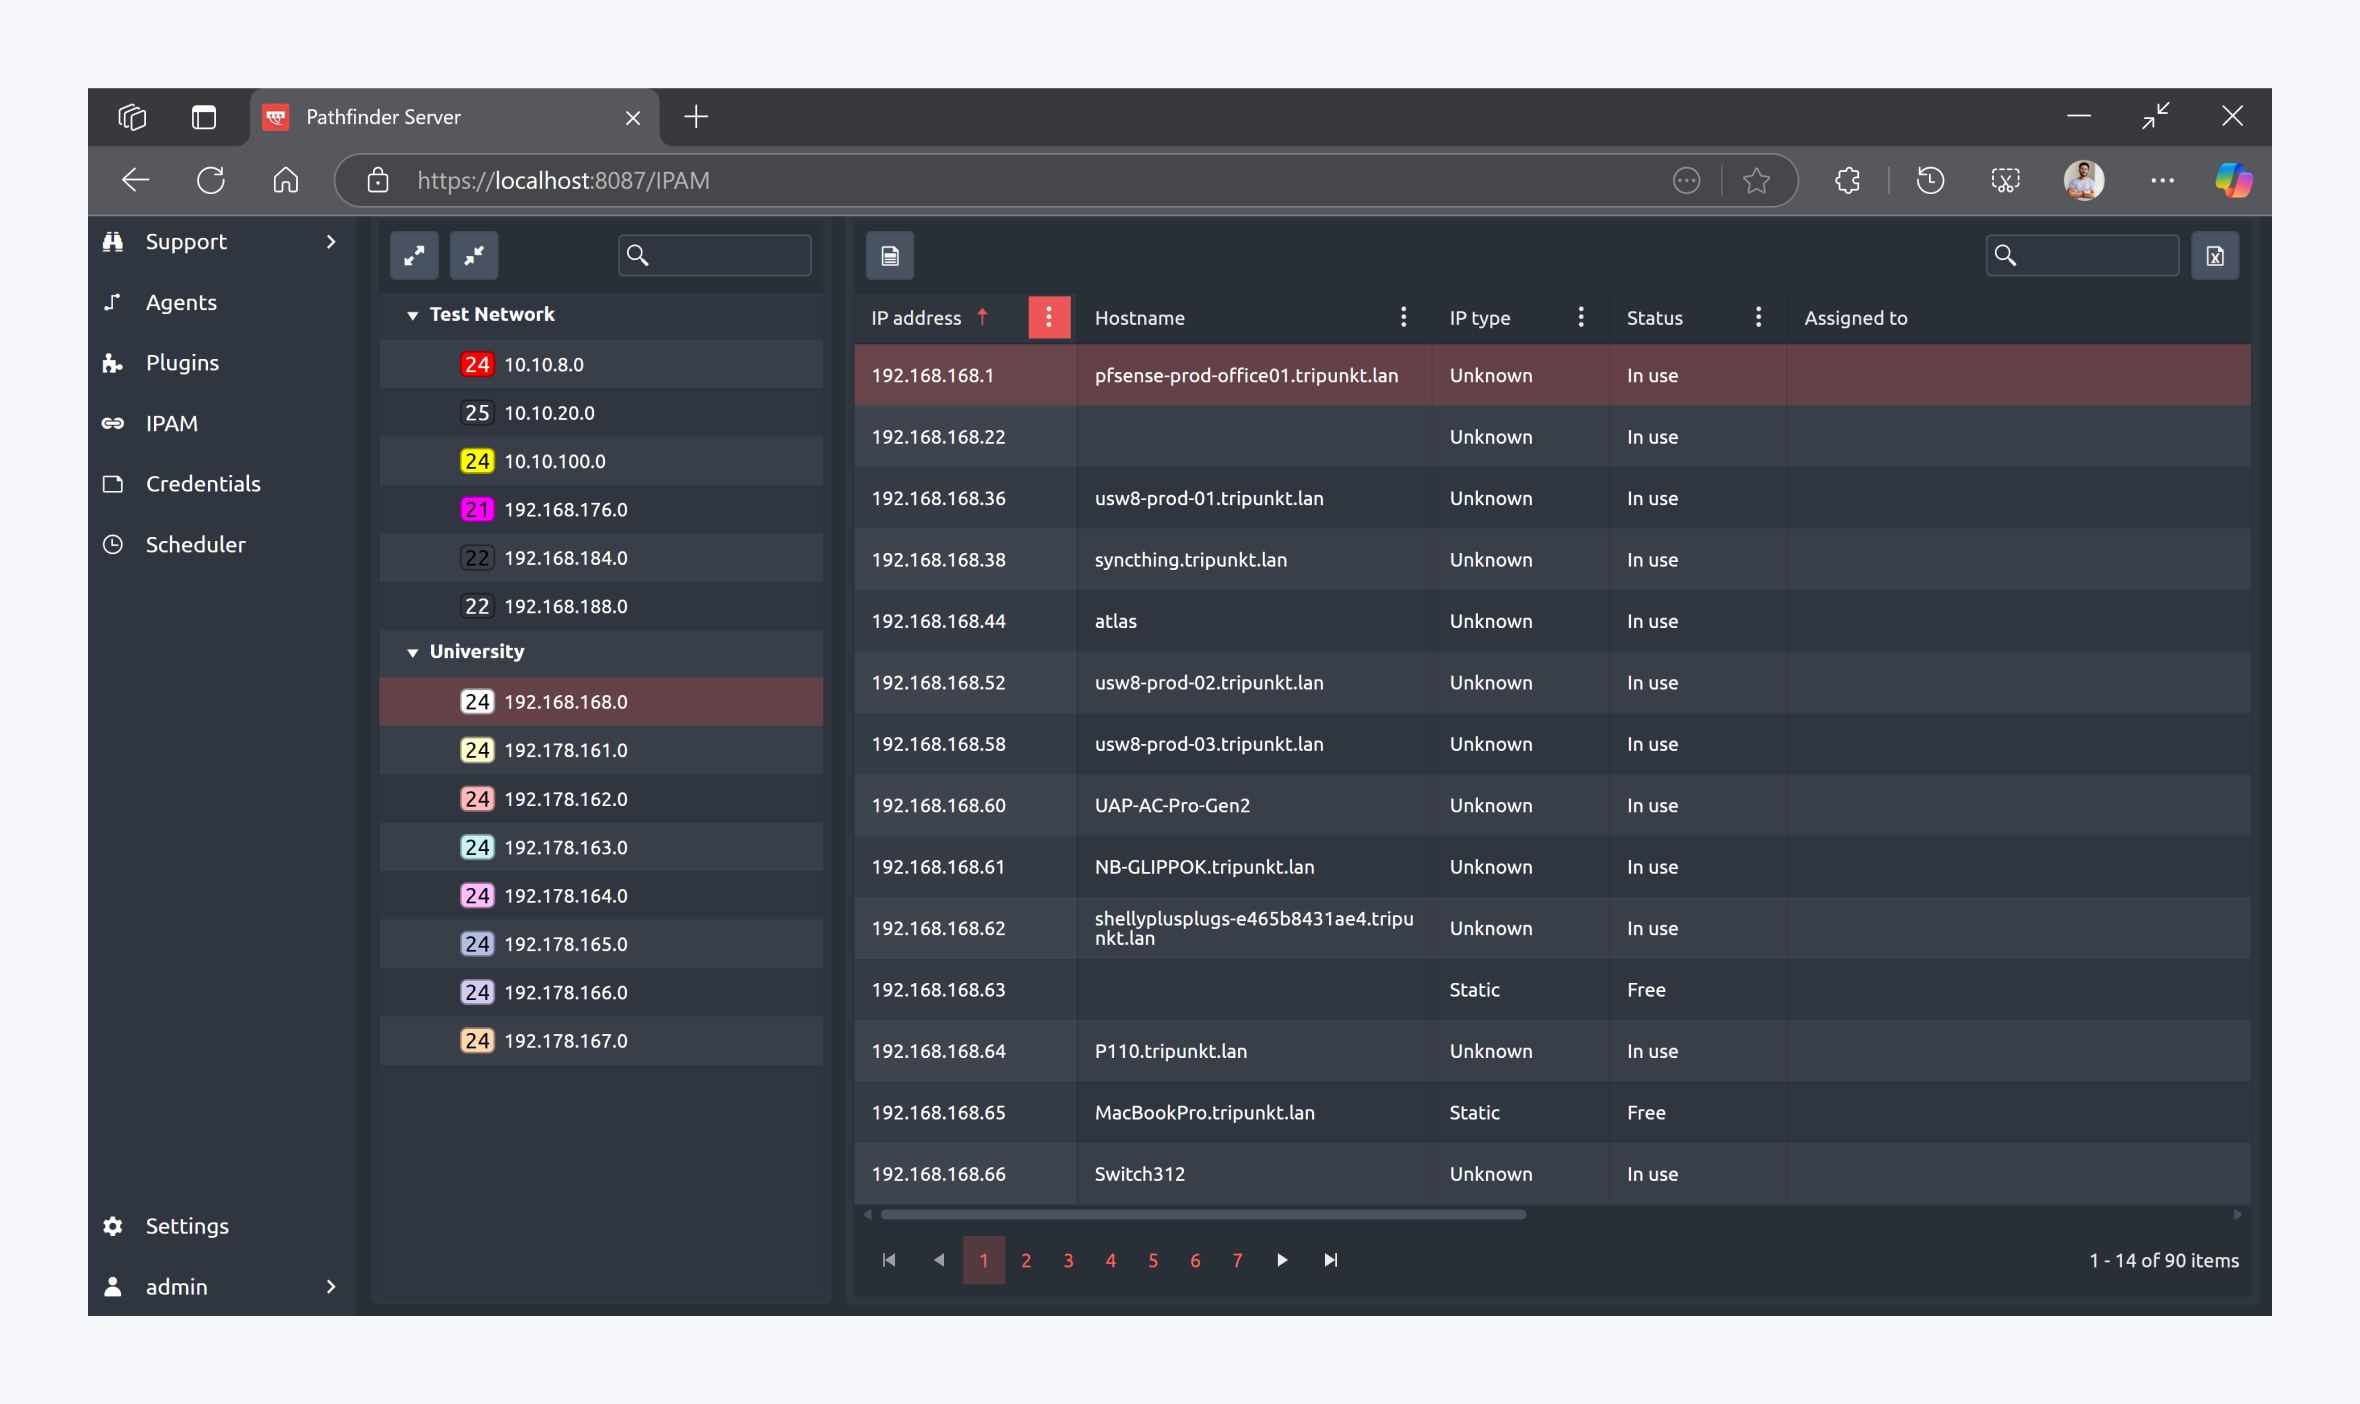
IPAM
The IPAM section of the Pathfinder Server interface provides a read-only view of all subnets, IP addresses and discovery data managed within the system. This module is designed to give users visibility into IP utilization and discovery results without allowing direct modification. This section supports network auditing and planning by providing a centralized, structured view of IP address allocation and activity across all monitored subnets.
Key Features:
Subnet and IP Address Overview
Displays all configured subnets, grouped by categories, each with associated IP ranges and color-coded indicators.
Lists individual IP addresses with metadata including:
Hostname
IP Type (e.g., static, dynamic, unknown)
Status (e.g., in use, free)
Assigned To (device or user)
Double click on an IP address to view details.
Discovery Job Results
Selecting an IP address and clicking on the show discovery data icon allows users to access historical discovery data.
Discovery results include timestamps and detailed scan information retrieved during scheduled jobs.
Credentials
Critical for maintaining secure, authenticated communication between Pathfinder and the devices it monitors, Credentials section of the Pathfinder Server interface enables secure management of authentication data used for network discovery and device monitoring. Credentials are essential for ensuring that only authorized access is granted to network infrastructure components.
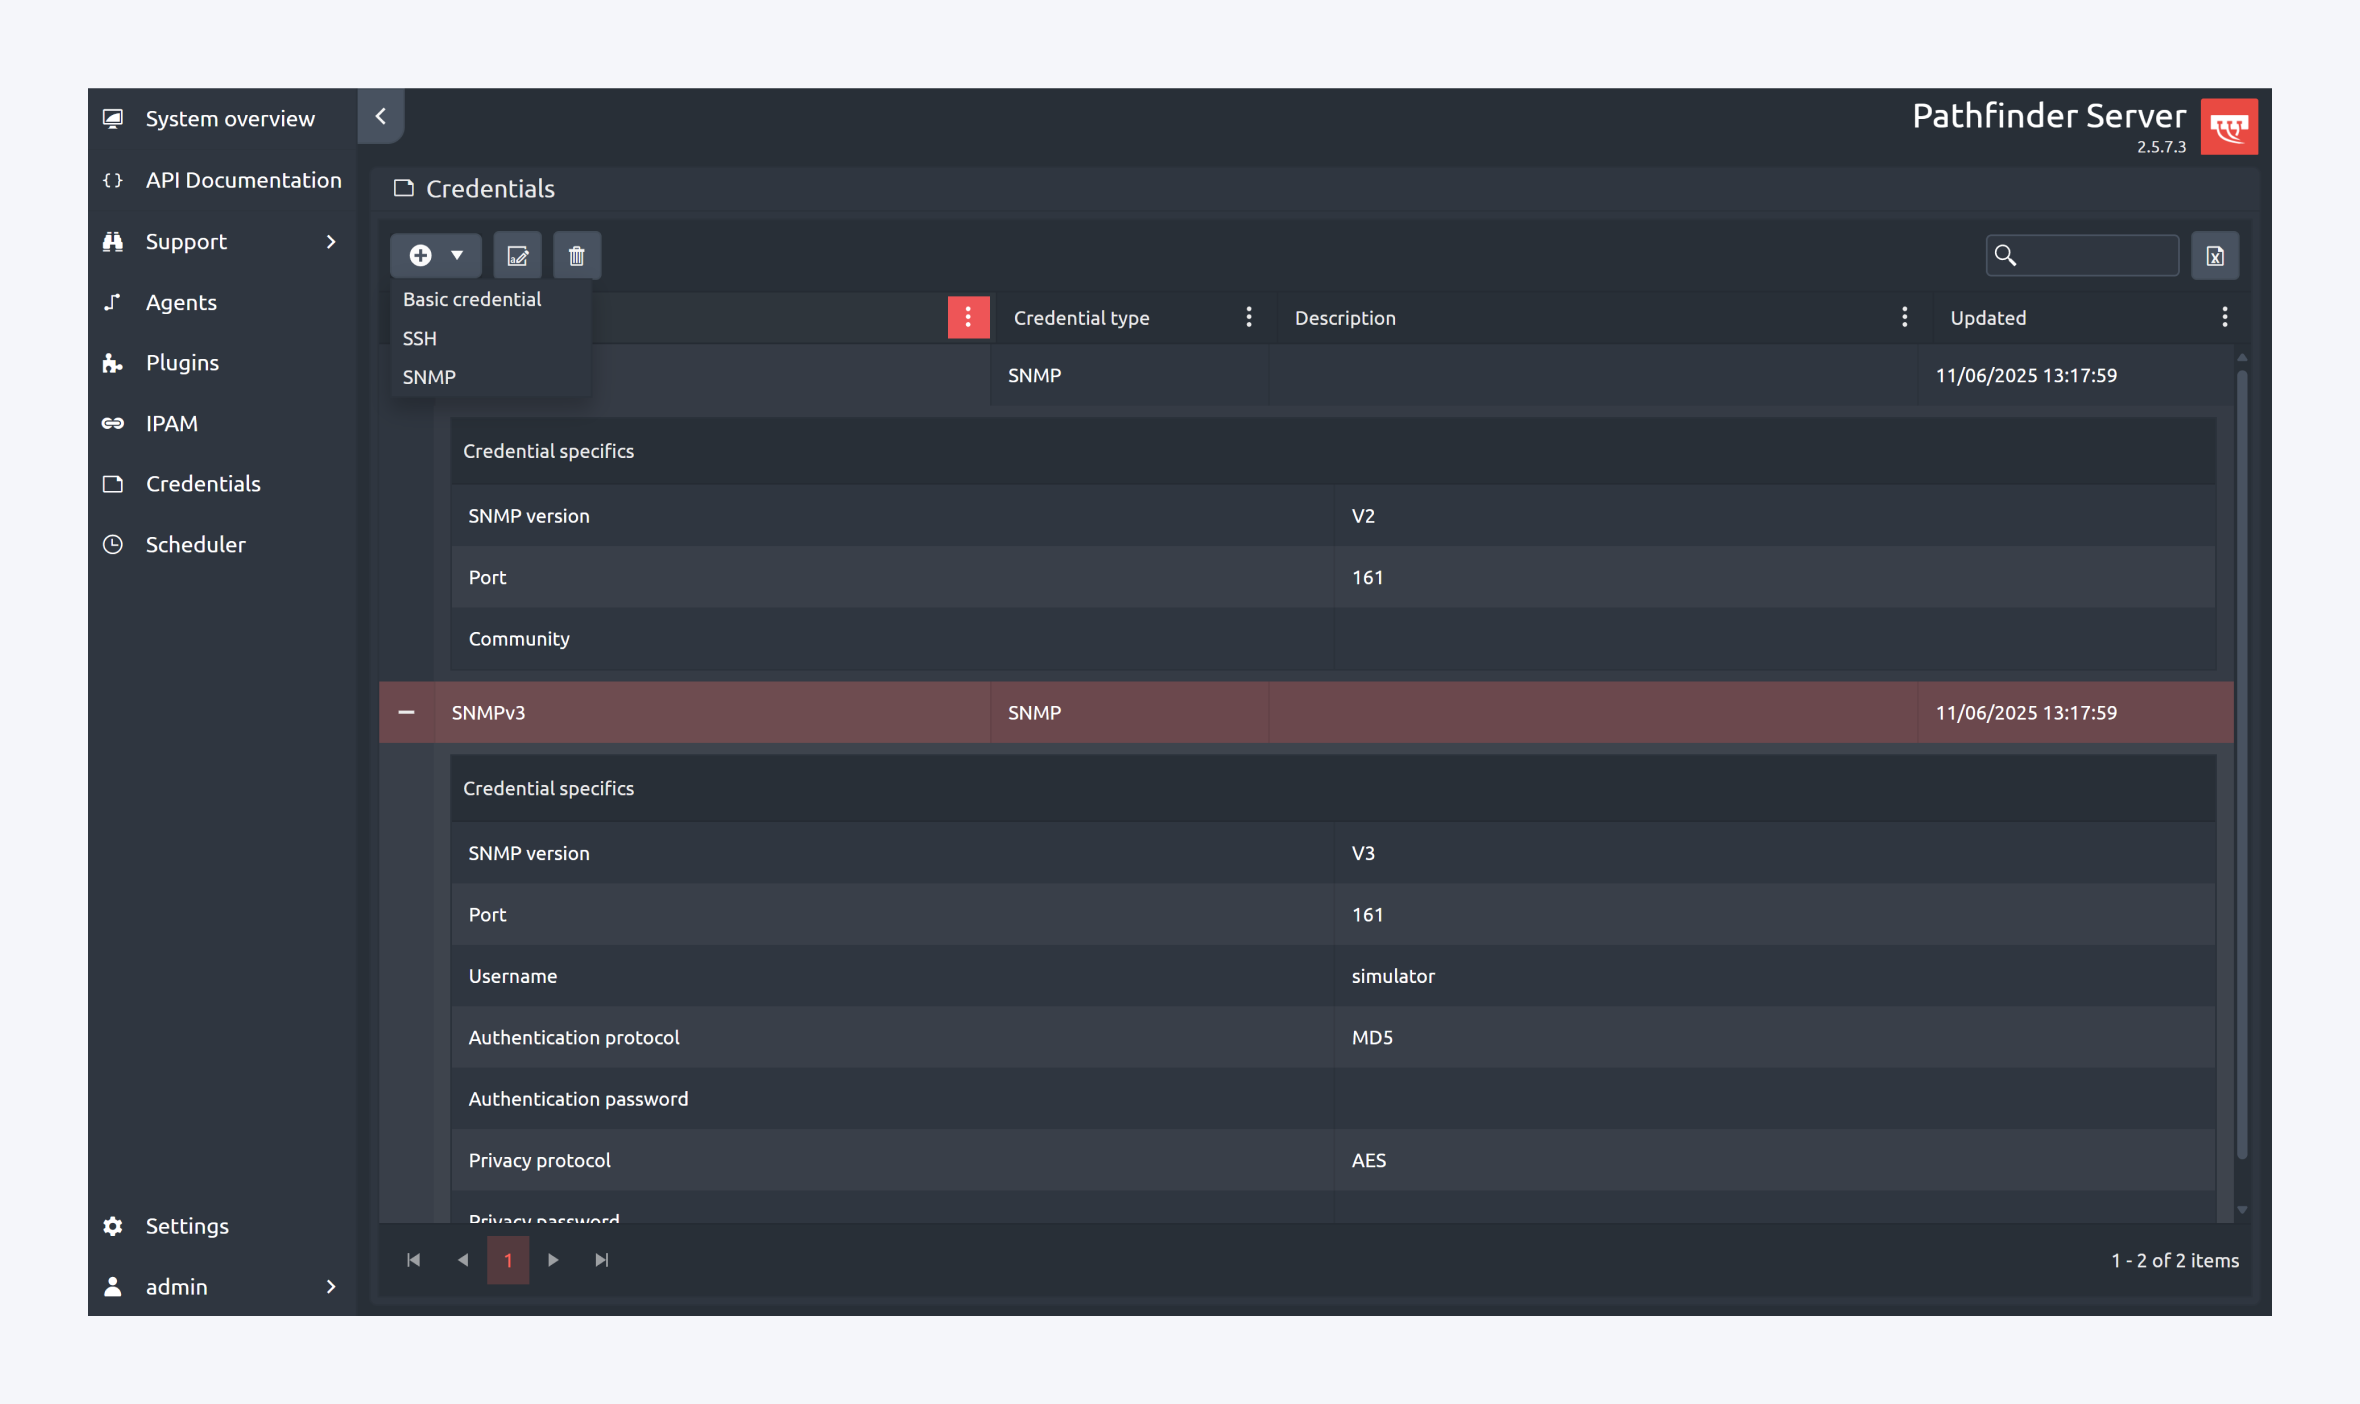
Key Features:
Credential Types
Supports multiple authentication methods including:
Basic Credentials
SSH
SNMP (v1, v2c, v3)
Credential Configuration
Each credential entry includes:
SNMP version and port
Community string (for SNMPv1/v2c)
Username and authentication details (for SNMPv3)
Authentication and privacy protocols
Last updated timestamp
Security Enforcement
Credentials are securely stored and used during discovery jobs to authenticate against network devices.
Only valid credentials allow access to device data, ensuring compliance with security policies and minimizing unauthorized access risks.
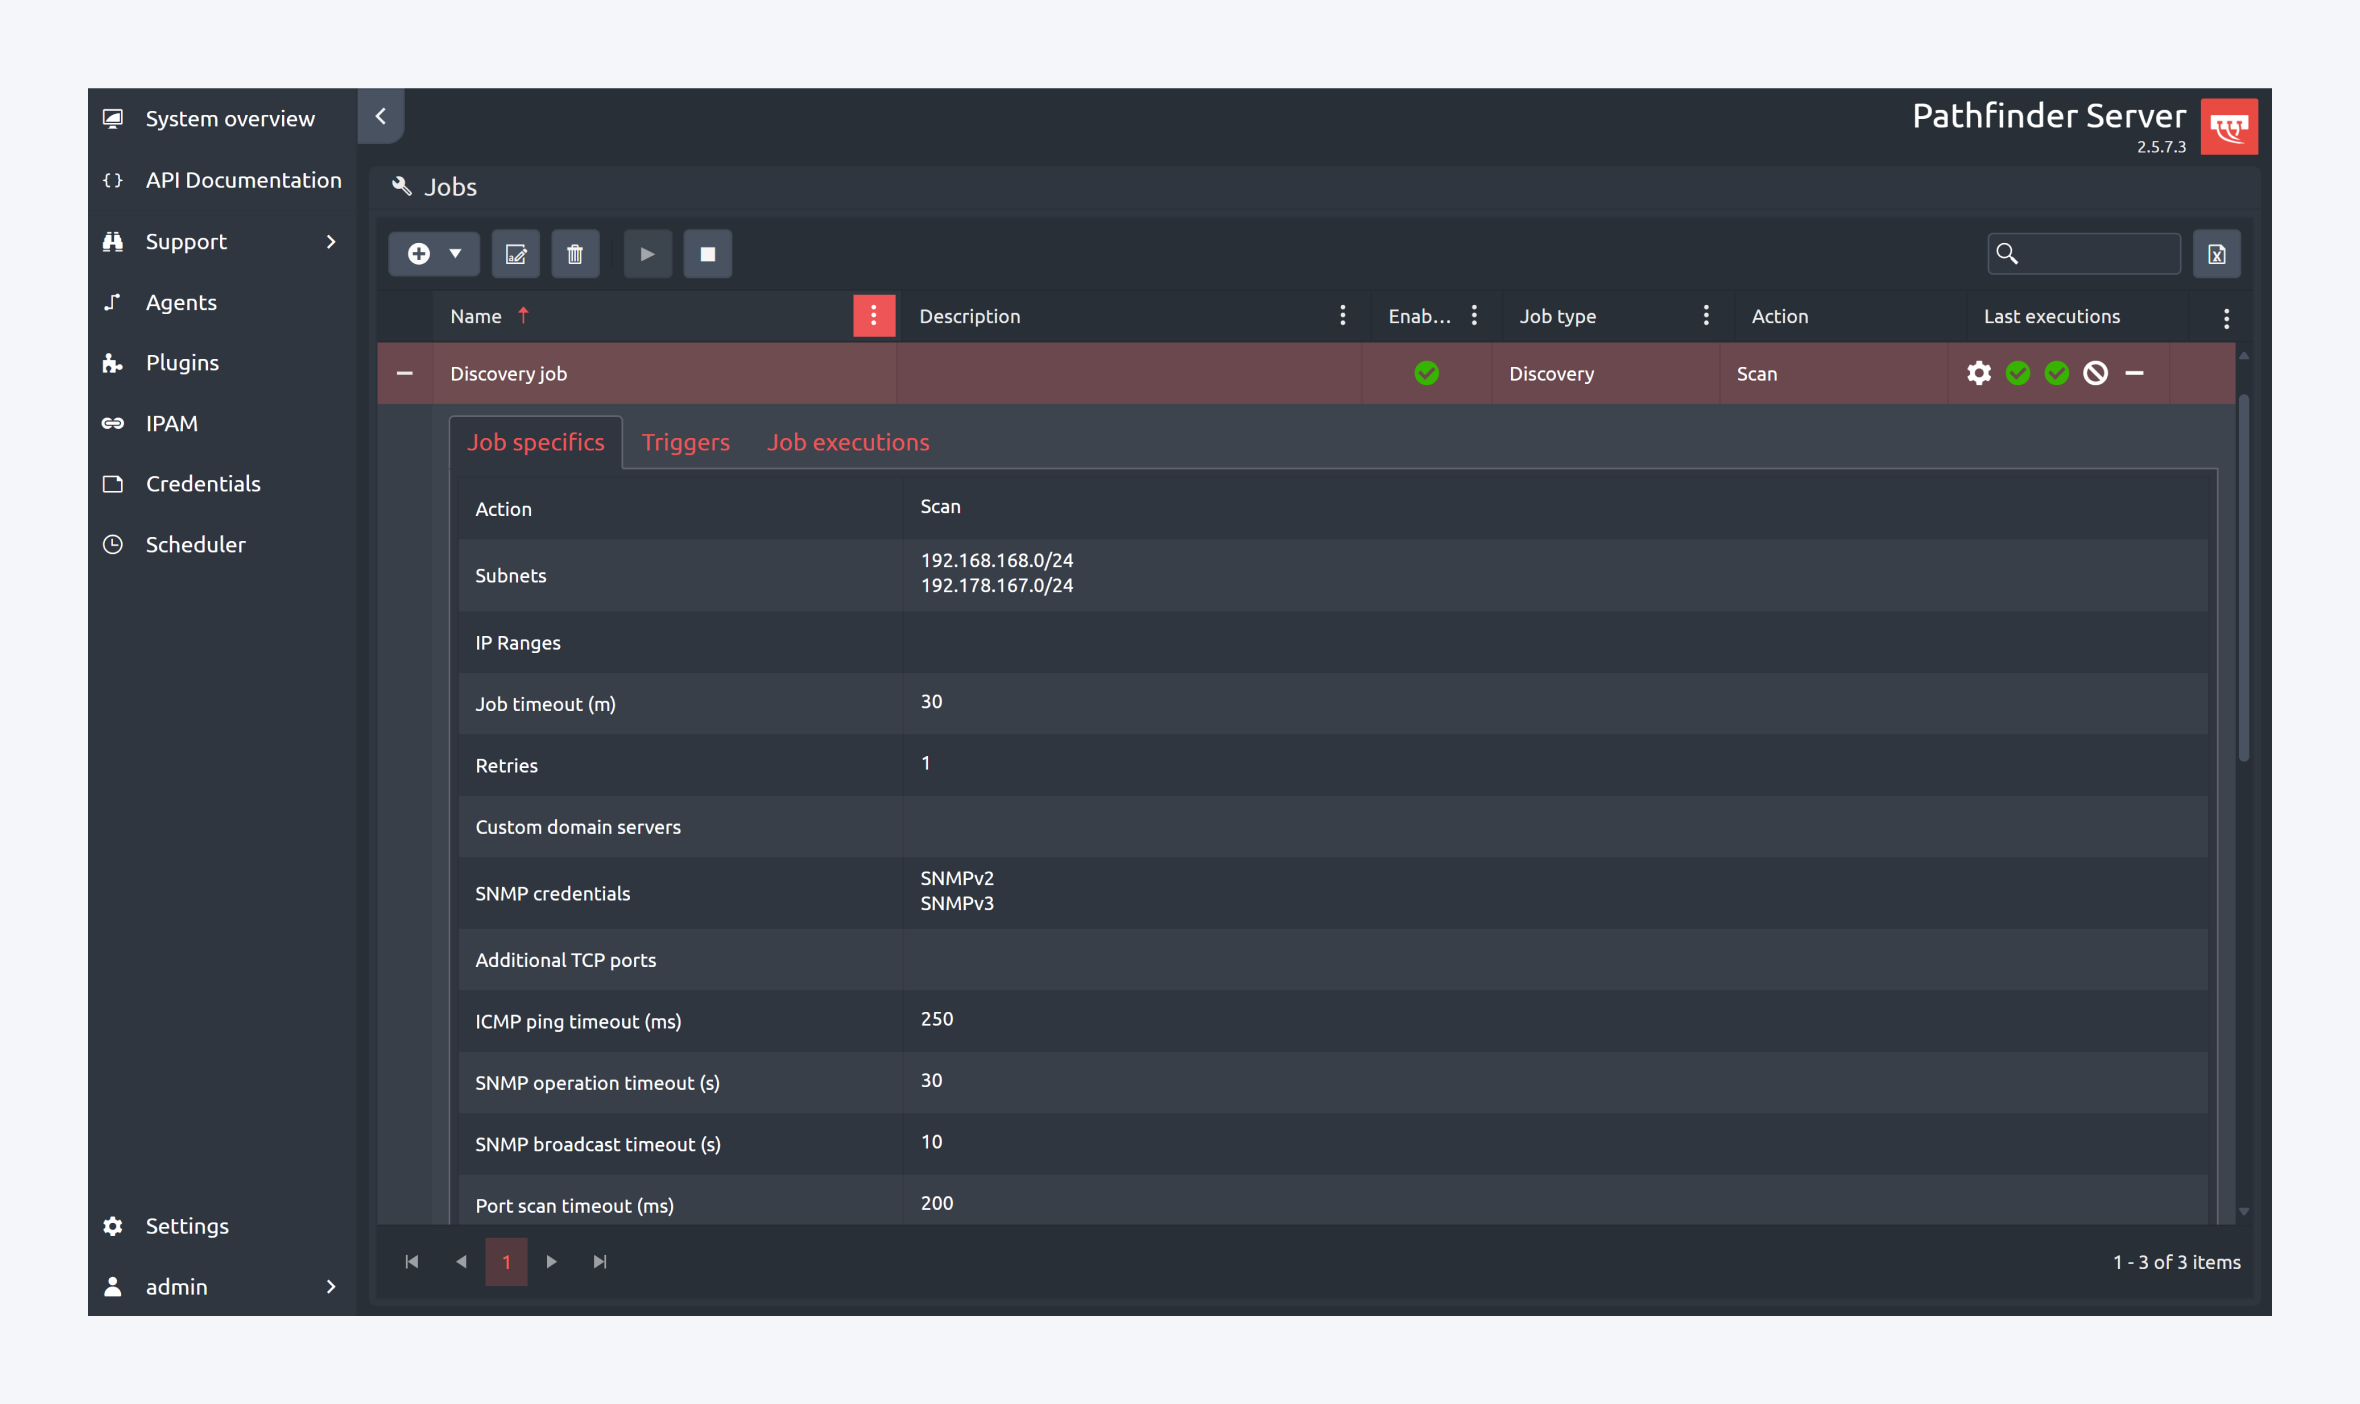
Schedulers
Users have the capability to configure discovery jobs for subnet scanning and data retrieval based on predefined intervals. Additionally, users can set up Python jobs to execute specific Python scripts at scheduled intervals. This section also provides access to real-time logs detailing the execution of these tasks, as well as comprehensive final reports upon job completion.
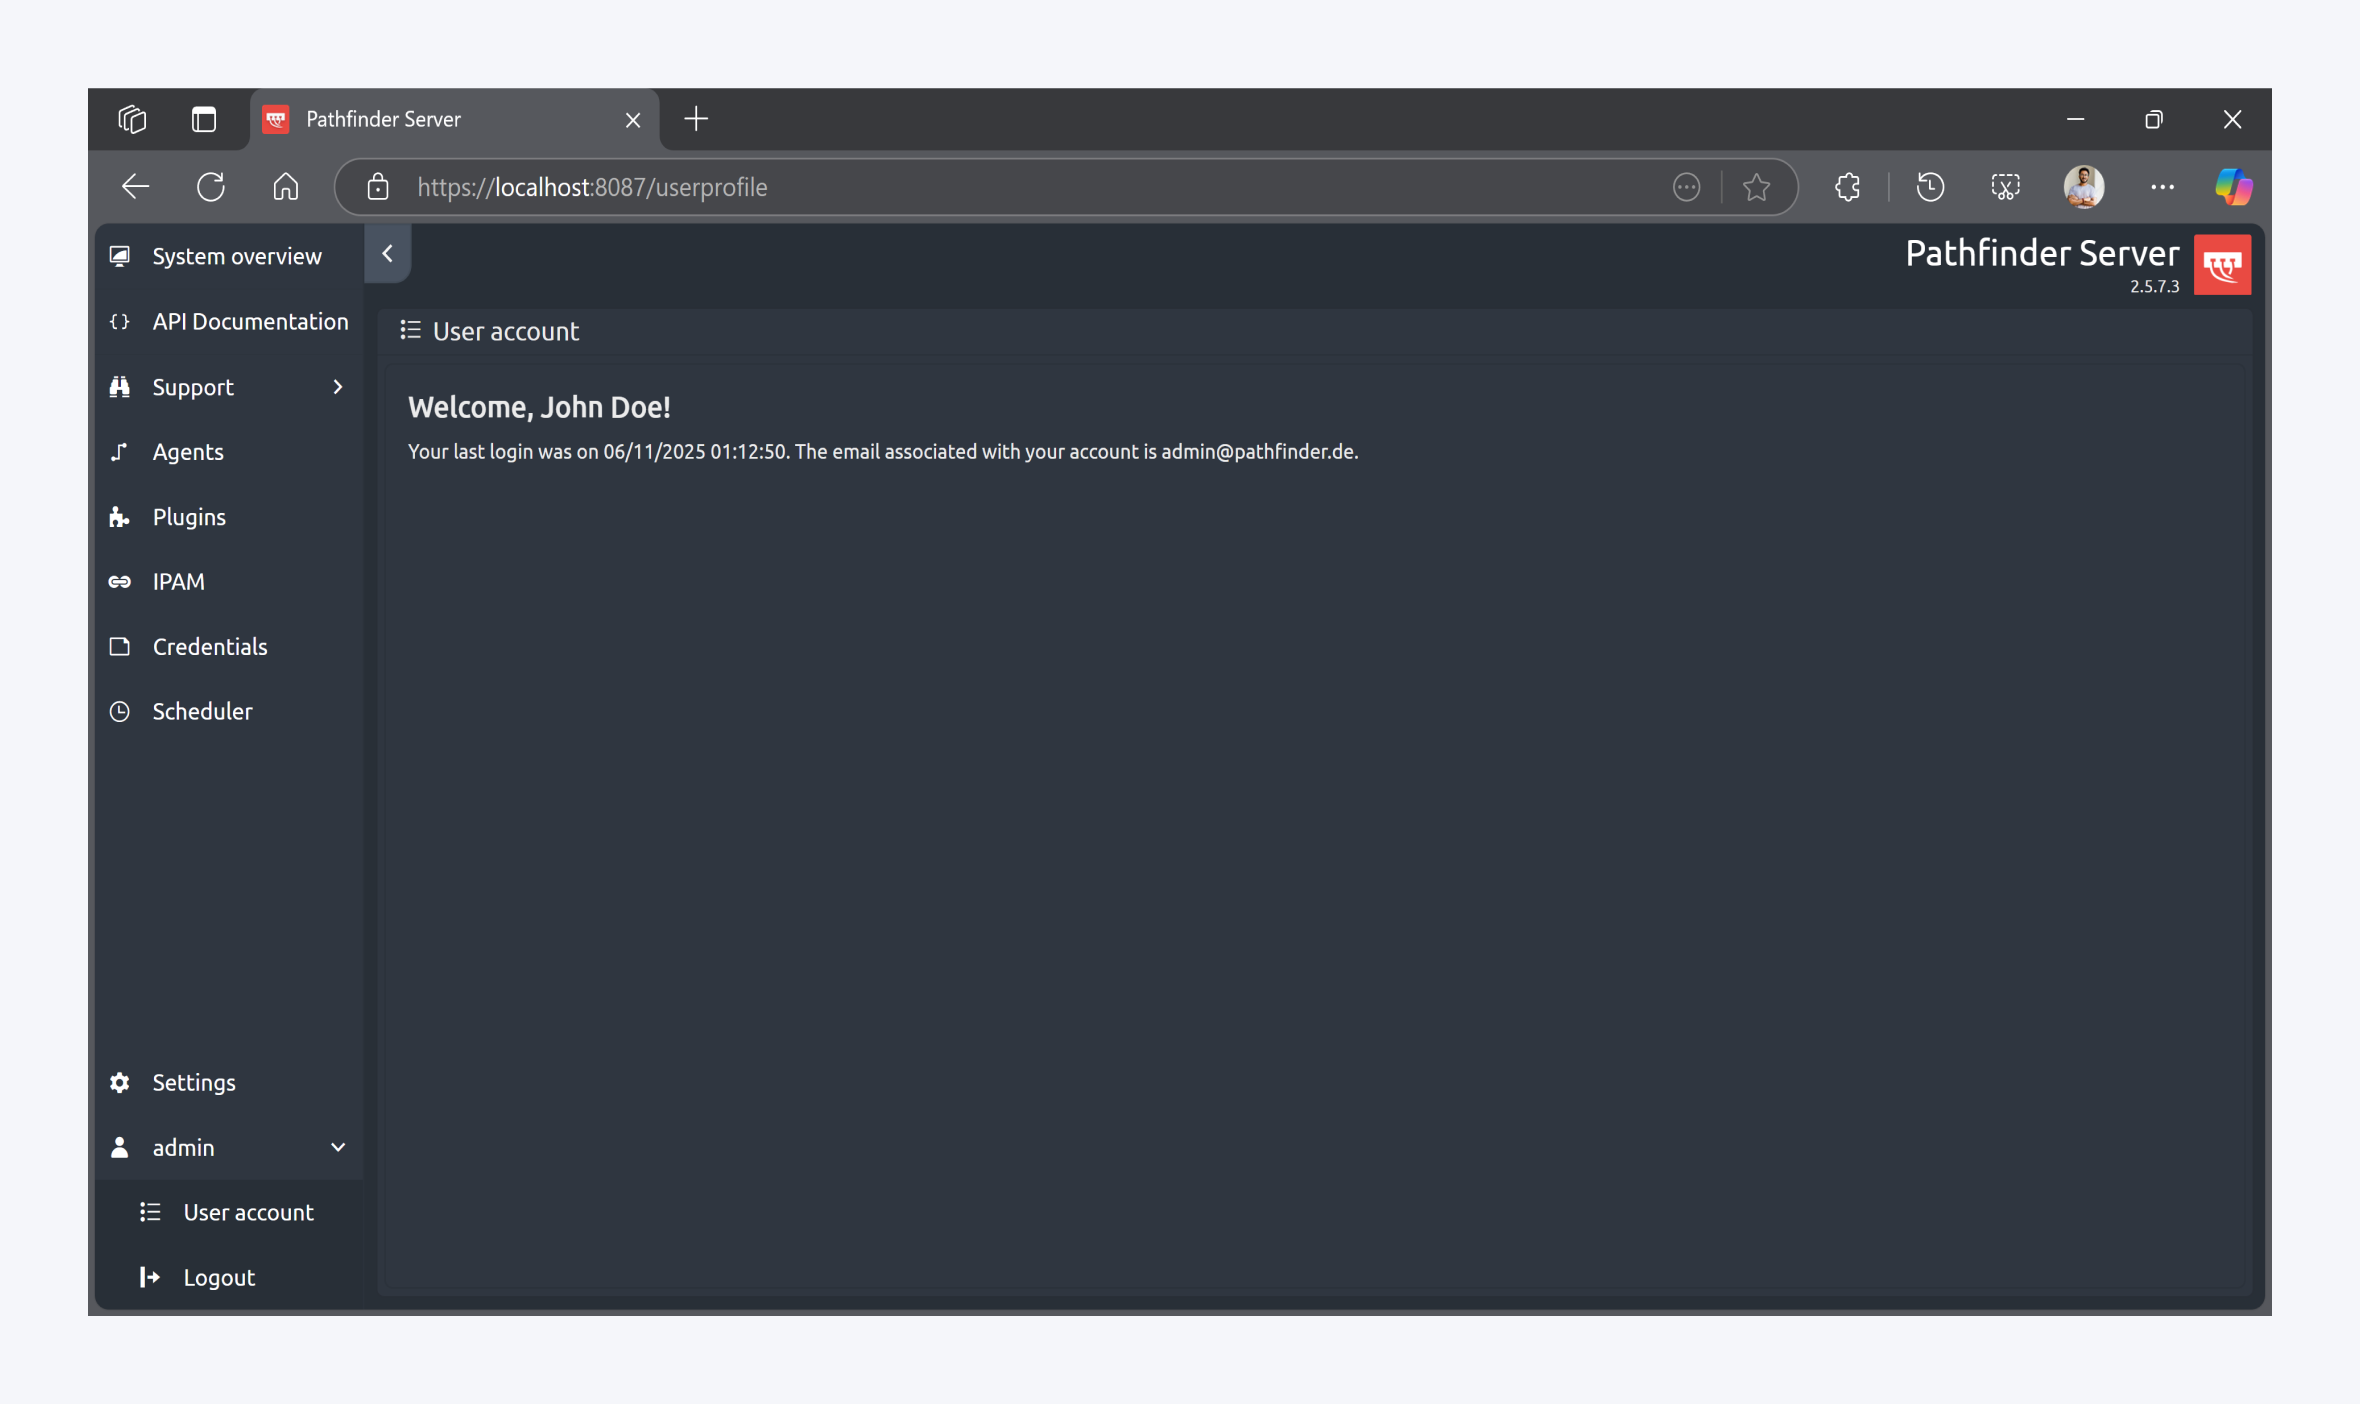
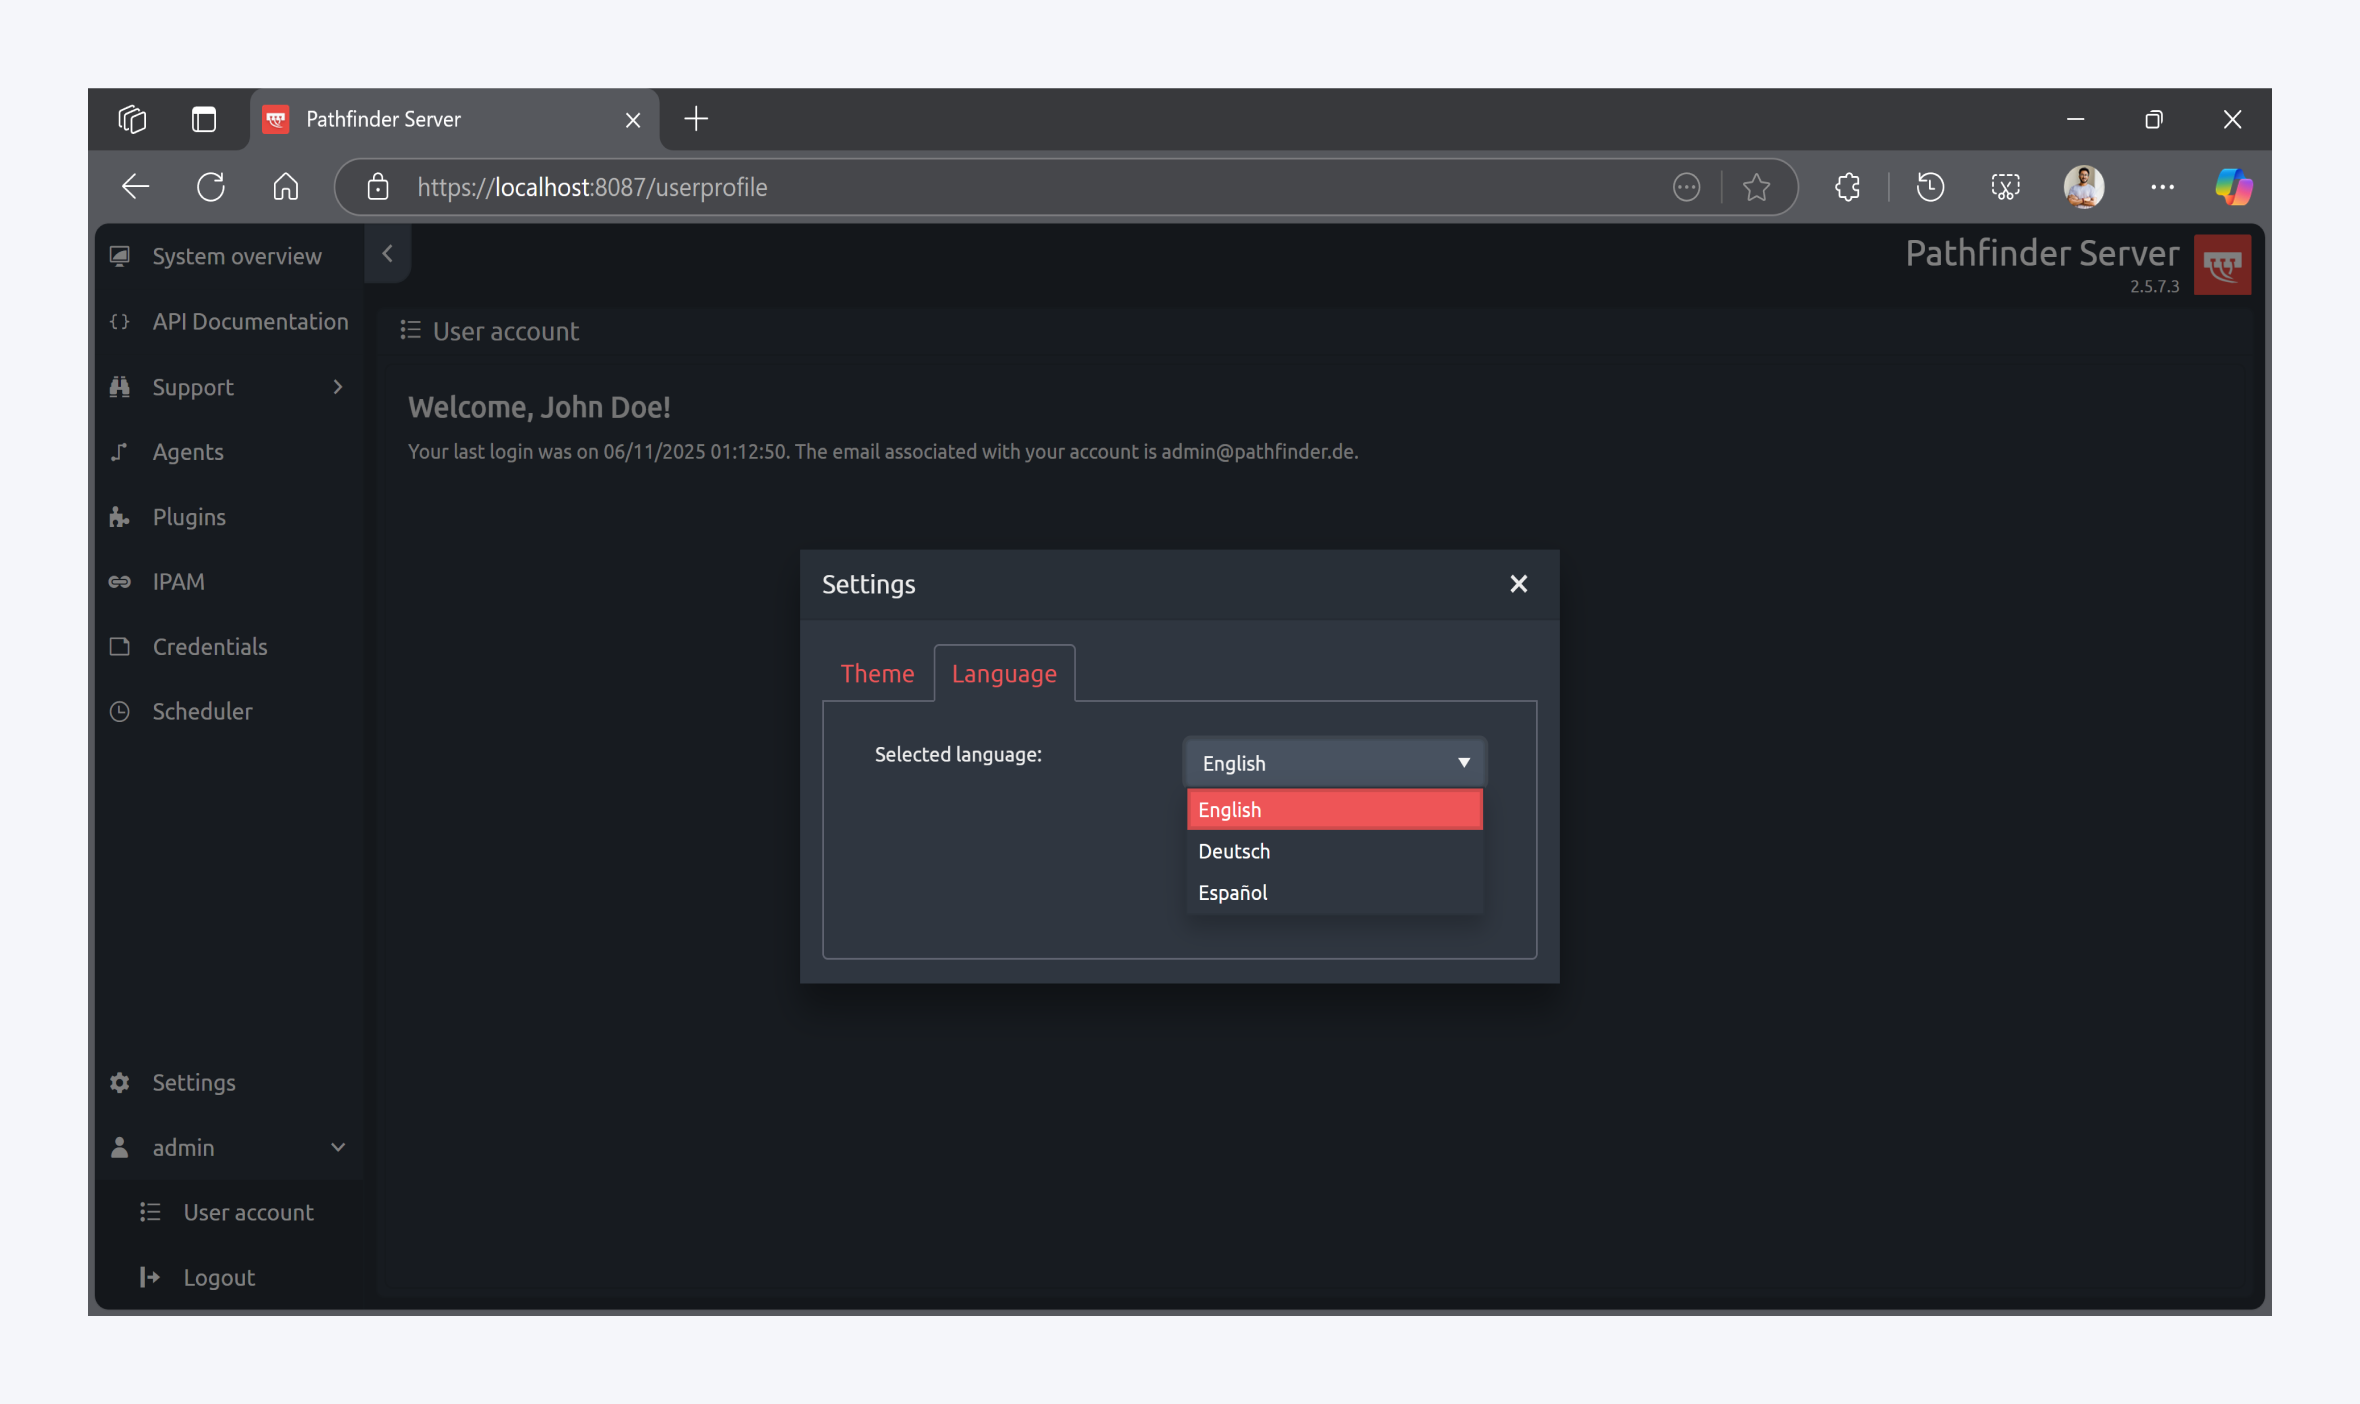
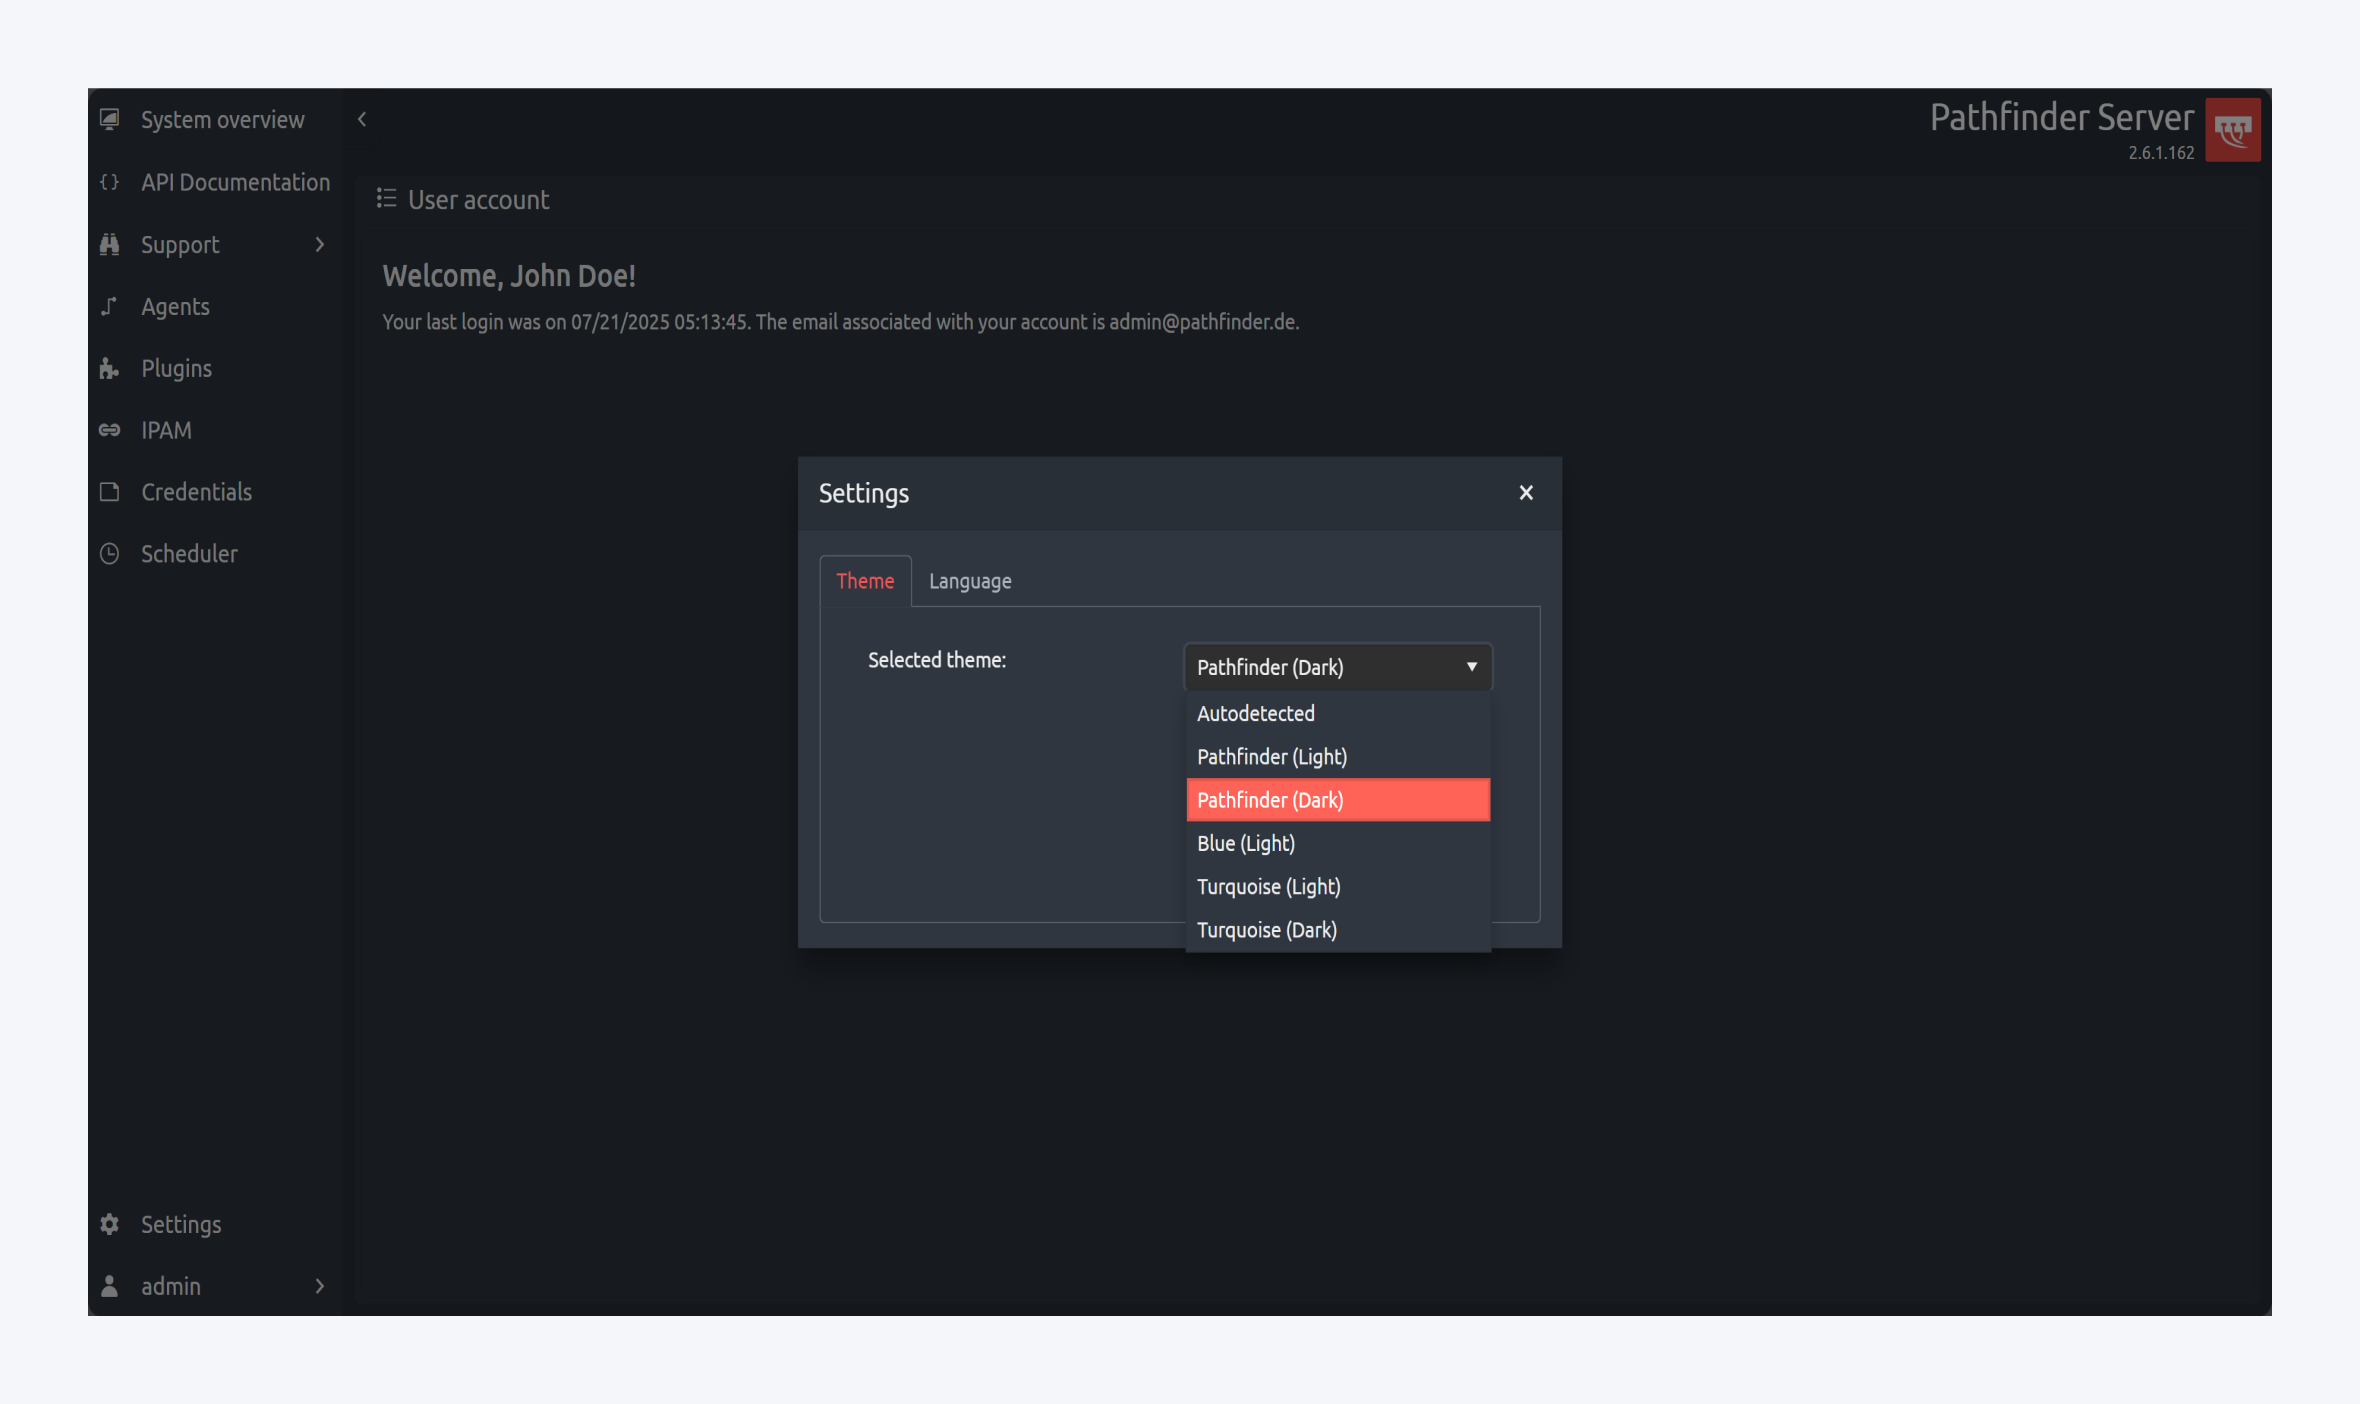
Settings
When the user clicks on that icon, a popup allowing to change the visual theming or the language is shown. The changes apply immediately and are persistent.
Version
Shows release notes, current version and build by clicking on question mark icon.
Current user
By clicking on the user icon, a popup with detailed information will be shown, and from there the user can logout.